
 Yahoo Finance
 Is Aecon Group Inc.'s (TSE:ARE) Latest Stock Performance A Reflection Of Its Financial Health?
Aecon Group (TSE:ARE) has had a great run on the share market with its stock up by a significant 22% over the last three months. Given that the market rewards strong financials in the long-term, we wonder if that is the case in this instance. Particularly, we will be paying attention to Aecon Group's ROE today.
ROE or return on equity is a useful tool to assess how effectively a company can generate returns on the investment it received from its shareholders. In short, ROE shows the profit each dollar generates with respect to its shareholder investments.
View our latest analysis for Aecon Group
How Do You Calculate Return On Equity?
Return on equity can be calculated by using the formula:
Return on Equity = Net Profit (from continuing operations) ÷ Shareholders' Equity
So, based on the above formula, the ROE for Aecon Group is:
16% = CA$165m ÷ CA$1.1b (Based on the trailing twelve months to March 2024).
The 'return' is the income the business earned over the last year. So, this means that for every CA$1 of its shareholder's investments, the company generates a profit of CA$0.16.
What Has ROE Got To Do With Earnings Growth?
Thus far, we have learned that ROE measures how efficiently a company is generating its profits. Depending on how much of these profits the company reinvests or "retains", and how effectively it does so, we are then able to assess a company’s earnings growth potential. Assuming all else is equal, companies that have both a higher return on equity and higher profit retention are usually the ones that have a higher growth rate when compared to companies that don't have the same features.
Aecon Group's Earnings Growth And 16% ROE
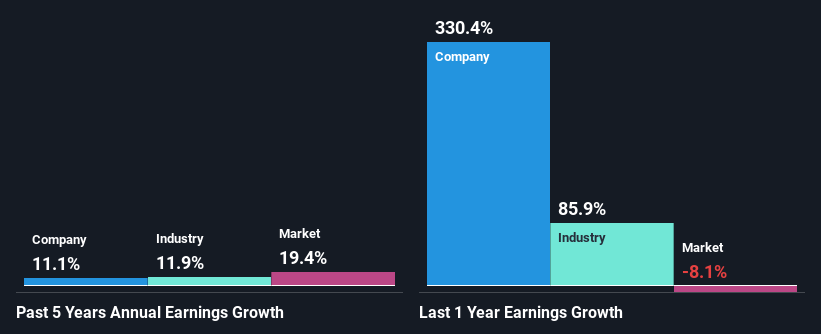
To start with, Aecon Group's ROE looks acceptable. Further, the company's ROE is similar to the industry average of 14%. This certainly adds some context to Aecon Group's moderate 11% net income growth seen over the past five years.
As a next step, we compared Aecon Group's net income growth with the industry and found that the company has a similar growth figure when compared with the industry average growth rate of 12% in the same period.
Earnings growth is an important metric to consider when valuing a stock. The investor should try to establish if the expected growth or decline in earnings, whichever the case may be, is priced in. Doing so will help them establish if the stock's future looks promising or ominous. Is Aecon Group fairly valued compared to other companies? These 3 valuation measures might help you decide.
Is Aecon Group Making Efficient Use Of Its Profits?
The high three-year median payout ratio of 62% (or a retention ratio of 38%) for Aecon Group suggests that the company's growth wasn't really hampered despite it returning most of its income to its shareholders.
Additionally, Aecon Group has paid dividends over a period of at least ten years which means that the company is pretty serious about sharing its profits with shareholders.
Summary
On the whole, we feel that Aecon Group's performance has been quite good. Especially the high ROE, Which has contributed to the impressive growth seen in earnings. Despite the company reinvesting only a small portion of its profits, it still has managed to grow its earnings so that is appreciable. With that said, on studying the latest analyst forecasts, we found that while the company has seen growth in its past earnings, analysts expect its future earnings to shrink. To know more about the company's future earnings growth forecasts take a look at this free report on analyst forecasts for the company to find out more.
Have feedback on this article? Concerned about the content? Get in touch with us directly. Alternatively, email editorial-team (at) simplywallst.com.
This article by Simply Wall St is general in nature. We provide commentary based on historical data and analyst forecasts only using an unbiased methodology and our articles are not intended to be financial advice. It does not constitute a recommendation to buy or sell any stock, and does not take account of your objectives, or your financial situation. We aim to bring you long-term focused analysis driven by fundamental data. Note that our analysis may not factor in the latest price-sensitive company announcements or qualitative material. Simply Wall St has no position in any stocks mentioned.
