
 Yahoo Finance
 Avacta Group (LON:AVCT) investors are sitting on a loss of 82% if they invested three years ago
As an investor, mistakes are inevitable. But you want to avoid the really big losses like the plague. So spare a thought for the long term shareholders of Avacta Group Plc (LON:AVCT); the share price is down a whopping 82% in the last three years. That would certainly shake our confidence in the decision to own the stock. And the ride hasn't got any smoother in recent times over the last year, with the price 62% lower in that time. Shareholders have had an even rougher run lately, with the share price down 56% in the last 90 days. We note that the company has reported results fairly recently; and the market is hardly delighted. You can check out the latest numbers in our company report. We really feel for shareholders in this scenario. It's a good reminder of the importance of diversification, and it's worth keeping in mind there's more to life than money, anyway.
So let's have a look and see if the longer term performance of the company has been in line with the underlying business' progress.
See our latest analysis for Avacta Group
Because Avacta Group made a loss in the last twelve months, we think the market is probably more focussed on revenue and revenue growth, at least for now. Generally speaking, companies without profits are expected to grow revenue every year, and at a good clip. That's because it's hard to be confident a company will be sustainable if revenue growth is negligible, and it never makes a profit.
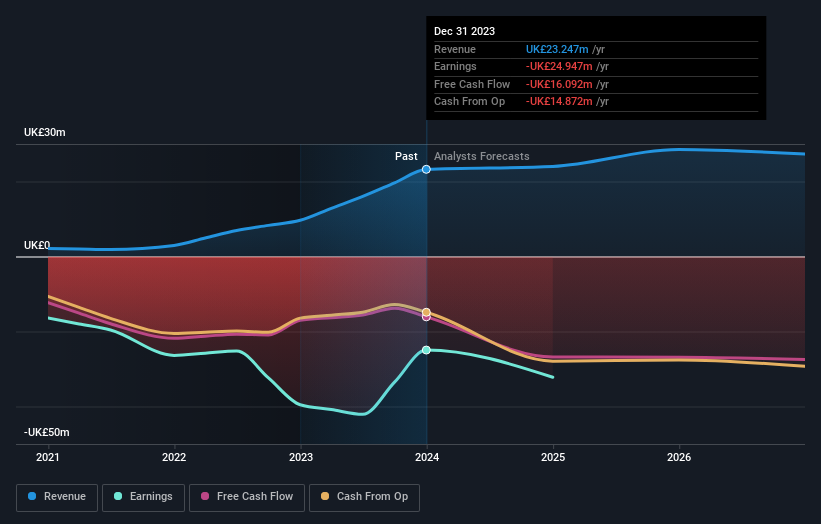
Over three years, Avacta Group grew revenue at 75% per year. That is faster than most pre-profit companies. So why has the share priced crashed 22% per year, in the same time? You'd want to take a close look at the balance sheet, as well as the losses. Sometimes fast revenue growth doesn't lead to profits. Unless the balance sheet is strong, the company might have to raise capital.
The graphic below depicts how earnings and revenue have changed over time (unveil the exact values by clicking on the image).
This free interactive report on Avacta Group's balance sheet strength is a great place to start, if you want to investigate the stock further.
A Different Perspective
Avacta Group shareholders are down 62% for the year, but the market itself is up 6.7%. However, keep in mind that even the best stocks will sometimes underperform the market over a twelve month period. On the bright side, long term shareholders have made money, with a gain of 9% per year over half a decade. It could be that the recent sell-off is an opportunity, so it may be worth checking the fundamental data for signs of a long term growth trend. It's always interesting to track share price performance over the longer term. But to understand Avacta Group better, we need to consider many other factors. Take risks, for example - Avacta Group has 4 warning signs (and 1 which is a bit concerning) we think you should know about.
If you are like me, then you will not want to miss this free list of growing companies that insiders are buying.
Please note, the market returns quoted in this article reflect the market weighted average returns of stocks that currently trade on British exchanges.
Have feedback on this article? Concerned about the content? Get in touch with us directly. Alternatively, email editorial-team (at) simplywallst.com.
This article by Simply Wall St is general in nature. We provide commentary based on historical data and analyst forecasts only using an unbiased methodology and our articles are not intended to be financial advice. It does not constitute a recommendation to buy or sell any stock, and does not take account of your objectives, or your financial situation. We aim to bring you long-term focused analysis driven by fundamental data. Note that our analysis may not factor in the latest price-sensitive company announcements or qualitative material. Simply Wall St has no position in any stocks mentioned.
