
 Yahoo Finance
 Digging deeper into Tesco's decline with the DuPont formula
Tesco has had a rough ride over recent years, issuing a series of profit warnings while the CEO has been ousted and the dividend has been cut. Meanwhile, brokers have consistently downgraded their earnings estimates and the share price has fallen by nearly 50% over the past two years (to around £1.88). The company has not traded at these levels since the early 2000s. Hindsight is a beautiful thing, but it isn’t necessarily useful in the stockmarket. Investors need to know about the bad news before share prices collapse.
Was there any writing on the wall? At a first glance - apparently not. Tesco sustained a high return on equity from 2006 through the recession until 2012, when the company issued its first profit warning. Even so, there were red flags lurking behind these numbers. A useful tool to spot them is the DuPont formula which helps investors deconstruct the drivers behind the RoE. Let’s explore this further...
What is the DuPont formula?
Return on equity (RoE) reveals how much profit a company generates compared to the total amount of equity on its balance sheet. On one hand, a high RoE can signal high profitability, but the ratio can be misleading because even if profits remain flat, a company can generate a higher RoE by taking on more borrowing. This can reduce the size of the denominator (ie. equity) compared to the numerator (ie. net income).
To overcome this problem, the DuPont formula breaks a company’s RoE into three parts (see below) and enables investors to identify the source of superior (or inferior) returns.
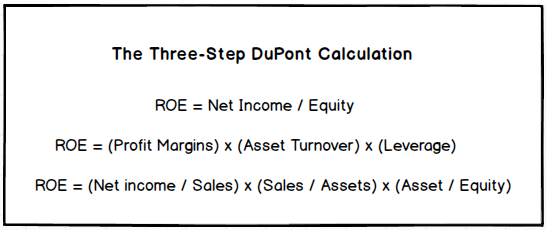
Generally speaking, a high RoE could come from three sources:
High Net Margins: Companies with a strong business franchise may be well placed to sell a product at a higher price than the costs incurred during the production process. These companies typically generate strong Profit Margins relative to their peer group.
High Asset Turnover: Some companies, particularly retailers, sell products with low profit margins. However, they sell their products in large volumes and thereby generate a high Asset Turnover - the amount of sales relative to the assets needed to create those sales.
High Leverage: Revenues and profit margins sometimes plateau or even shrink. When this happens, companies can still generate strong returns by using leverage, as we mentioned above - albeit at higher risk.
Analysing Tesco


Declining Asset Turnover
Tesco succeeded in growing sales through the recession from £39,454m (2006) to £60,455m (2010) before they increased even further to £63,557m by the end of 2013. Impressive? Not necessarily... To drive this growth the company needed to use more than twice as many assets. Sales grew by 61% while assets increased by 122%. In other words, the company was becoming less effective at using assets to generate revenues.
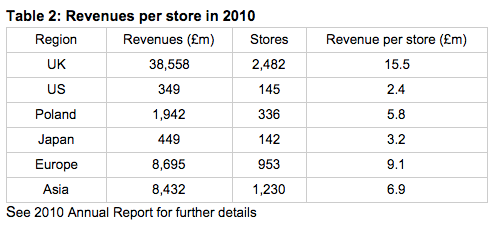
Their overseas expansion was arguably an ineffective use of assets. The company set foot in the States in 2007 but pulled out in 2013. What went wrong? The firm was only generating £2.4m per store, compared to £15.5m back in the UK (see Table 2). The company also tried to expand into Europe. In 2006 they acquired 220 stores in Poland from the French Group, Casino (see here). Again, the returns were poor. By 2010 the company was generating less than £6m per store in Poland - well below the UK benchmark. Revenues also came under pressure as a result of pricing competition with discounters like Aldi and Lidl.
So how did the firm retain high returns? We can explore a second component of the RoE, leverage, to find out.
Rising Leverage
In his 1979 Letter to Shareholders, the legendary Warren Buffett wrote that ‘the primary test of managerial economic performance is the achievement of a high earnings rate on equity capital employed (without undue leverage, accounting gimmickry ect)’. Buffett owns shares in Tesco. Surely he wouldn’t invest in a company with ‘undue leverage’. Apparently he would.
We can see that leverage has shot up between 2006 and 2014. The asset to equity ratio was 2.4 in 2006, rising to 2.5 by 2008, 2.8 by 2010 and 3.01 in 2013. Then it rose to 3.4 in 2014 before increasing to 6.3 in 2015. Between 2006 and 2014:
The firm’s leverage is now a cause for concern amongst some City analysts. Clive Black at Shore Capital recently told The Telegraph that ‘Tesco is demonstrably over-leveraged, as outlined by management with a combined £21.7bn of net debt, operating lease commitments and pension deficit and it needs to de-leverage, materially so.’
This FT article by Terry Smith of Fundsmith LLP explains exactly what went wrong. In 14 of the 18 years ending 2014 Tesco generated negative free cash flows. The company was not generating enough cash to pay dividends and debt became an important source of financing. Smith points out that “Tesco’s gross debt, which was £894m when Sir Terry took over, peaked at nearly £15.9bn in 2009. The company spent much of its free cash on fixed-asset investment and raised debt to help pay the dividend. This is neither healthy nor sustainable, as investors in Tesco have now come to realise...”
Profit Margins
Leverage isn’t necessarily a bad thing. Companies may decide to acquire assets (eg. inventory, stores or factories) using debt. In an ideal world the inventory would be sold for a profit while the stores generate money to pay off liabilities. Problems occur when assets fail to make money and companies need to get rid of unprofitable assets. When this happens, firms may incur impairment, restructuring and other expenses, thereby constraining profit margins. Margins can be constrained further as companies continue to pay interest expense on liabilities.
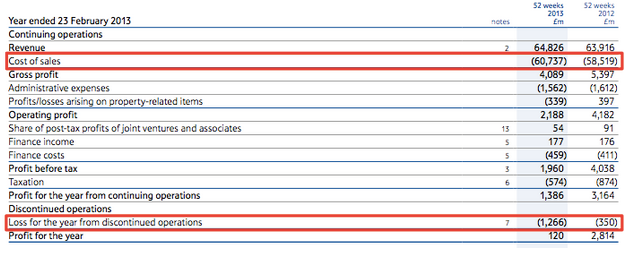
Unprofitable operations in Europe also led to higher costs and tighter profits. The annual report shows that ‘an impairment charge of £495m arose in the year in Poland (£373m), Czech Republic (£69m) and Turkey (£53m) following a period of difficult economic and trading conditions. This loss has been recognised in the cost of sales’. So it seems that Tesco bit off more than it could chew. It expanded in the US and Europe but failed to generate strong sales in these regions (see Table 2). It eventually needed to write down the value of some overseas assets and dispose of others, thereby creating expenses and lowering profits.
By the end of 2015 profit margins had fallen to -9.2%. The firm’s restructuring programme was a key factor that led to higher expenses and tighter profits. The company has set out to restructure central overheads, simplify store management structures, and increase working-hour flexibility in an effort to deliver savings in the region of £400m per year. These efficiencies have already resulted in a one-off cost of £300m. Restructuring costs are also reflected in the cost of goods sold and administrative expenses - as the annual report explains. The company also incurred a number of impairment expenses. Tesco’s annual review resulted in an impairment charge of £3.8bn against trading stores, while the impairment of works-in progress resulted in a further impairment charge of £925m.
What can investors learn from Tesco’s DuPont Formula?
Historians will know that some of the strongest empires have fallen because the rulers don’t know when enough is enough. Napoleon was unbeatable in Europe until he ventured into Russia and came away with his tail between his legs. It seems that Tesco made a similar mistake.
During the 2000s Tesco stores were popping up everywhere in Britain, but overseas success proved more elusive and profits, as well as the RoE, suffered in 2013 when the company finally needed to retreat. Ineffective overseas expansion was not the only factor that led to a lower asset turnover. Price wars with discounters and unfavourable exchange rates have also placed downwards pressure on revenues.
The point here is that the asset turnover declined since 2006 and the company only sustained a high RoE by using leverage, not by becoming more efficient in its use of capital. Tools like the DuPont formula would have helped us realise this and perhaps spot the increasing risk before the fall.
DuPont can also help us spot the first signs of a turnaround. Rather than take the RoE at face value, it would be better to break it down into its component parts. High profit margins in the retail sector are unlikely, so I would be on the lookout for a higher asset turnover driven by growth in sales. Stronger sales could lead to healthier cashflows. This could help the company balance the books by paying off liabilities, rather than discarding unprofitable assets and incurring impairment expenses in the process.
Read More about Tesco on Stockopedia
Discuss Tesco on Stockopedia
