
 Yahoo Finance
 Estimating The Intrinsic Value Of HSS Hire Group plc (LON:HSS)
Key Insights
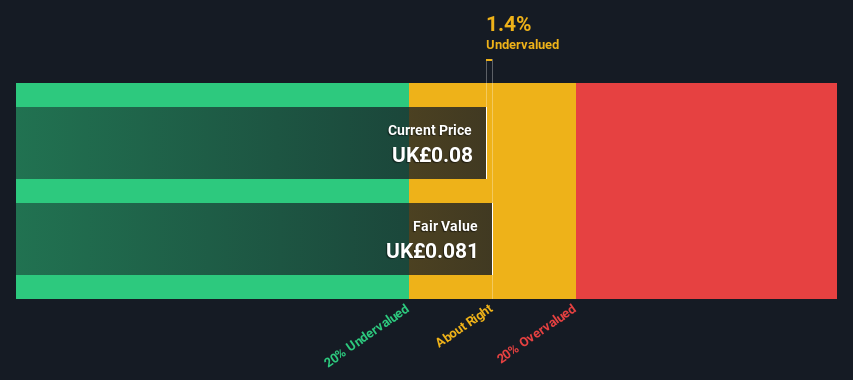
Using the Dividend Discount Model, HSS Hire Group fair value estimate is UK£0.081
Current share price of UK£0.08 suggests HSS Hire Group is potentially trading close to its fair value
Today we'll do a simple run through of a valuation method used to estimate the attractiveness of HSS Hire Group plc (LON:HSS) as an investment opportunity by taking the expected future cash flows and discounting them to their present value. This will be done using the Discounted Cash Flow (DCF) model. Before you think you won't be able to understand it, just read on! It's actually much less complex than you'd imagine.
Remember though, that there are many ways to estimate a company's value, and a DCF is just one method. If you want to learn more about discounted cash flow, the rationale behind this calculation can be read in detail in the Simply Wall St analysis model.
Check out our latest analysis for HSS Hire Group
The Method
We have to calculate the value of HSS Hire Group slightly differently to other stocks because it is a trade distributors company. Instead of using free cash flows, which are hard to estimate and often not reported by analysts in this industry, dividends per share (DPS) payments are used. Unless a company pays out the majority of its FCF as a dividend, this method will typically underestimate the value of the stock. The 'Gordon Growth Model' is used, which simply assumes that dividend payments will continue to increase at a sustainable growth rate forever. The dividend is expected to grow at an annual growth rate equal to the 5-year average of the 10-year government bond yield of 1.8%. We then discount this figure to today's value at a cost of equity of 9.1%. Relative to the current share price of UK£0.08, the company appears about fair value at a 1.4% discount to where the stock price trades currently. Valuations are imprecise instruments though, rather like a telescope - move a few degrees and end up in a different galaxy. Do keep this in mind.
Value Per Share = Expected Dividend Per Share / (Discount Rate - Perpetual Growth Rate)
= UK£0.006 / (9.1% – 1.8%)
= UK£0.08
Important Assumptions
We would point out that the most important inputs to a discounted cash flow are the discount rate and of course the actual cash flows. If you don't agree with these result, have a go at the calculation yourself and play with the assumptions. The DCF also does not consider the possible cyclicality of an industry, or a company's future capital requirements, so it does not give a full picture of a company's potential performance. Given that we are looking at HSS Hire Group as potential shareholders, the cost of equity is used as the discount rate, rather than the cost of capital (or weighted average cost of capital, WACC) which accounts for debt. In this calculation we've used 9.1%, which is based on a levered beta of 1.332. Beta is a measure of a stock's volatility, compared to the market as a whole. We get our beta from the industry average beta of globally comparable companies, with an imposed limit between 0.8 and 2.0, which is a reasonable range for a stable business.
SWOT Analysis for HSS Hire Group
Strength
Earnings growth over the past year exceeded the industry.
Debt is well covered by cash flow.
Dividend is in the top 25% of dividend payers in the market.
Weakness
Interest payments on debt are not well covered.
Opportunity
Good value based on P/E ratio and estimated fair value.
Threat
No apparent threats visible for HSS.
Looking Ahead:
Although the valuation of a company is important, it ideally won't be the sole piece of analysis you scrutinize for a company. DCF models are not the be-all and end-all of investment valuation. Preferably you'd apply different cases and assumptions and see how they would impact the company's valuation. If a company grows at a different rate, or if its cost of equity or risk free rate changes sharply, the output can look very different. For HSS Hire Group, we've put together three essential items you should consider:
Risks: Take risks, for example - HSS Hire Group has 4 warning signs (and 1 which is significant) we think you should know about.
Future Earnings: How does HSS's growth rate compare to its peers and the wider market? Dig deeper into the analyst consensus number for the upcoming years by interacting with our free analyst growth expectation chart.
Other High Quality Alternatives: Do you like a good all-rounder? Explore our interactive list of high quality stocks to get an idea of what else is out there you may be missing!
PS. The Simply Wall St app conducts a discounted cash flow valuation for every stock on the AIM every day. If you want to find the calculation for other stocks just search here.
Have feedback on this article? Concerned about the content? Get in touch with us directly. Alternatively, email editorial-team (at) simplywallst.com.
This article by Simply Wall St is general in nature. We provide commentary based on historical data and analyst forecasts only using an unbiased methodology and our articles are not intended to be financial advice. It does not constitute a recommendation to buy or sell any stock, and does not take account of your objectives, or your financial situation. We aim to bring you long-term focused analysis driven by fundamental data. Note that our analysis may not factor in the latest price-sensitive company announcements or qualitative material. Simply Wall St has no position in any stocks mentioned.
