
 Yahoo Finance
 Houlihan Lokey (NYSE:HLI) shareholders have earned a 26% CAGR over the last five years
The worst result, after buying shares in a company (assuming no leverage), would be if you lose all the money you put in. But when you pick a company that is really flourishing, you can make more than 100%. Long term Houlihan Lokey, Inc. (NYSE:HLI) shareholders would be well aware of this, since the stock is up 179% in five years. It's also good to see the share price up 12% over the last quarter. But this move may well have been assisted by the reasonably buoyant market (up 9.3% in 90 days).
Let's take a look at the underlying fundamentals over the longer term, and see if they've been consistent with shareholders returns.
Check out our latest analysis for Houlihan Lokey
In his essay The Superinvestors of Graham-and-Doddsville Warren Buffett described how share prices do not always rationally reflect the value of a business. One imperfect but simple way to consider how the market perception of a company has shifted is to compare the change in the earnings per share (EPS) with the share price movement.
During five years of share price growth, Houlihan Lokey achieved compound earnings per share (EPS) growth of 9.1% per year. This EPS growth is lower than the 23% average annual increase in the share price. This suggests that market participants hold the company in higher regard, these days. That's not necessarily surprising considering the five-year track record of earnings growth.
The company's earnings per share (over time) is depicted in the image below (click to see the exact numbers).
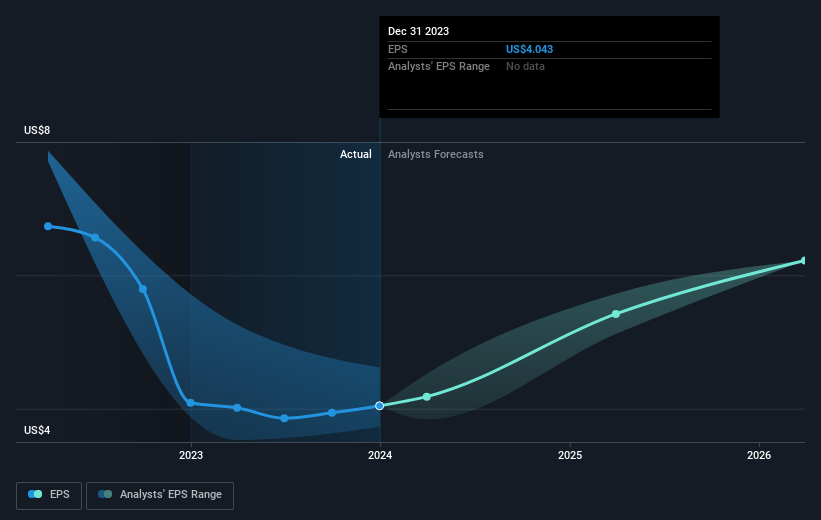
This free interactive report on Houlihan Lokey's earnings, revenue and cash flow is a great place to start, if you want to investigate the stock further.
What About Dividends?
When looking at investment returns, it is important to consider the difference between total shareholder return (TSR) and share price return. The TSR is a return calculation that accounts for the value of cash dividends (assuming that any dividend received was reinvested) and the calculated value of any discounted capital raisings and spin-offs. So for companies that pay a generous dividend, the TSR is often a lot higher than the share price return. As it happens, Houlihan Lokey's TSR for the last 5 years was 212%, which exceeds the share price return mentioned earlier. And there's no prize for guessing that the dividend payments largely explain the divergence!
A Different Perspective
We're pleased to report that Houlihan Lokey shareholders have received a total shareholder return of 55% over one year. And that does include the dividend. Since the one-year TSR is better than the five-year TSR (the latter coming in at 26% per year), it would seem that the stock's performance has improved in recent times. Someone with an optimistic perspective could view the recent improvement in TSR as indicating that the business itself is getting better with time. It's always interesting to track share price performance over the longer term. But to understand Houlihan Lokey better, we need to consider many other factors. For instance, we've identified 1 warning sign for Houlihan Lokey that you should be aware of.
If you like to buy stocks alongside management, then you might just love this free list of companies. (Hint: insiders have been buying them).
Please note, the market returns quoted in this article reflect the market weighted average returns of stocks that currently trade on American exchanges.
Have feedback on this article? Concerned about the content? Get in touch with us directly. Alternatively, email editorial-team (at) simplywallst.com.
This article by Simply Wall St is general in nature. We provide commentary based on historical data and analyst forecasts only using an unbiased methodology and our articles are not intended to be financial advice. It does not constitute a recommendation to buy or sell any stock, and does not take account of your objectives, or your financial situation. We aim to bring you long-term focused analysis driven by fundamental data. Note that our analysis may not factor in the latest price-sensitive company announcements or qualitative material. Simply Wall St has no position in any stocks mentioned.
