
 Yahoo Finance
 Investing in Craneware (LON:CRW) a year ago would have delivered you a 63% gain
Passive investing in index funds can generate returns that roughly match the overall market. But investors can boost returns by picking market-beating companies to own shares in. For example, the Craneware plc (LON:CRW) share price is up 60% in the last 1 year, clearly besting the market return of around 2.3% (not including dividends). If it can keep that out-performance up over the long term, investors will do very well! On the other hand, longer term shareholders have had a tougher run, with the stock falling 22% in three years.
Now it's worth having a look at the company's fundamentals too, because that will help us determine if the long term shareholder return has matched the performance of the underlying business.
See our latest analysis for Craneware
To paraphrase Benjamin Graham: Over the short term the market is a voting machine, but over the long term it's a weighing machine. One imperfect but simple way to consider how the market perception of a company has shifted is to compare the change in the earnings per share (EPS) with the share price movement.
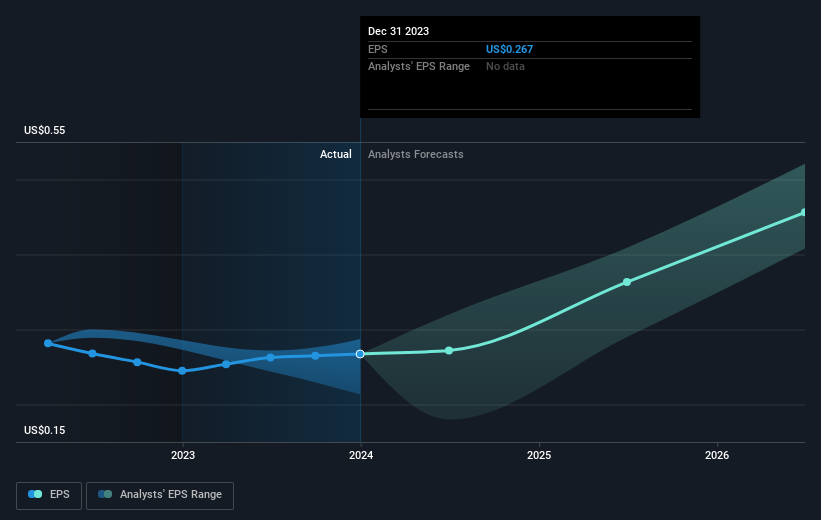
During the last year Craneware grew its earnings per share (EPS) by 9.1%. This EPS growth is significantly lower than the 60% increase in the share price. This indicates that the market is now more optimistic about the stock. The fairly generous P/E ratio of 99.38 also points to this optimism.
You can see how EPS has changed over time in the image below (click on the chart to see the exact values).
It's probably worth noting that the CEO is paid less than the median at similar sized companies. But while CEO remuneration is always worth checking, the really important question is whether the company can grow earnings going forward. Dive deeper into the earnings by checking this interactive graph of Craneware's earnings, revenue and cash flow.
What About Dividends?
It is important to consider the total shareholder return, as well as the share price return, for any given stock. The TSR incorporates the value of any spin-offs or discounted capital raisings, along with any dividends, based on the assumption that the dividends are reinvested. It's fair to say that the TSR gives a more complete picture for stocks that pay a dividend. In the case of Craneware, it has a TSR of 63% for the last 1 year. That exceeds its share price return that we previously mentioned. And there's no prize for guessing that the dividend payments largely explain the divergence!
A Different Perspective
It's good to see that Craneware has rewarded shareholders with a total shareholder return of 63% in the last twelve months. That's including the dividend. Notably the five-year annualised TSR loss of 3% per year compares very unfavourably with the recent share price performance. This makes us a little wary, but the business might have turned around its fortunes. If you would like to research Craneware in more detail then you might want to take a look at whether insiders have been buying or selling shares in the company.
We will like Craneware better if we see some big insider buys. While we wait, check out this free list of growing companies with considerable, recent, insider buying.
Please note, the market returns quoted in this article reflect the market weighted average returns of stocks that currently trade on British exchanges.
Have feedback on this article? Concerned about the content? Get in touch with us directly. Alternatively, email editorial-team (at) simplywallst.com.
This article by Simply Wall St is general in nature. We provide commentary based on historical data and analyst forecasts only using an unbiased methodology and our articles are not intended to be financial advice. It does not constitute a recommendation to buy or sell any stock, and does not take account of your objectives, or your financial situation. We aim to bring you long-term focused analysis driven by fundamental data. Note that our analysis may not factor in the latest price-sensitive company announcements or qualitative material. Simply Wall St has no position in any stocks mentioned.
