
 Yahoo Finance
 Investors Continue Waiting On Sidelines For Inspired Plc (LON:INSE)
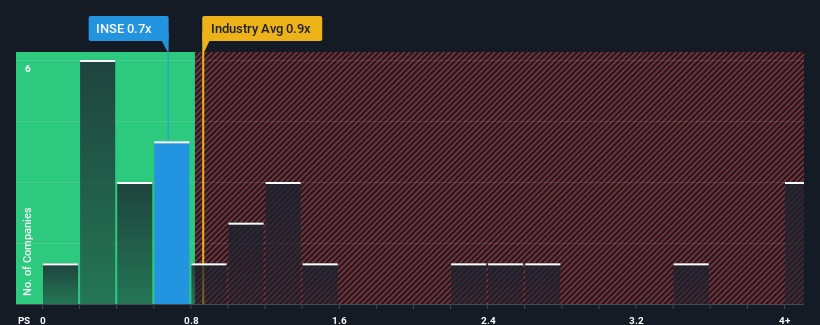
With a median price-to-sales (or "P/S") ratio of close to 0.9x in the Commercial Services industry in the United Kingdom, you could be forgiven for feeling indifferent about Inspired Plc's (LON:INSE) P/S ratio of 0.7x. However, investors might be overlooking a clear opportunity or potential setback if there is no rational basis for the P/S.
View our latest analysis for Inspired
What Does Inspired's Recent Performance Look Like?
With revenue growth that's inferior to most other companies of late, Inspired has been relatively sluggish. Perhaps the market is expecting future revenue performance to lift, which has kept the P/S from declining. You'd really hope so, otherwise you're paying a relatively elevated price for a company with this sort of growth profile.
Keen to find out how analysts think Inspired's future stacks up against the industry? In that case, our free report is a great place to start.
Is There Some Revenue Growth Forecasted For Inspired?
In order to justify its P/S ratio, Inspired would need to produce growth that's similar to the industry.
Taking a look back first, we see that the company grew revenue by an impressive 23% last year. The strong recent performance means it was also able to grow revenue by 97% in total over the last three years. Therefore, it's fair to say the revenue growth recently has been superb for the company.
Looking ahead now, revenue is anticipated to climb by 25% during the coming year according to the dual analysts following the company. With the industry only predicted to deliver 9.7%, the company is positioned for a stronger revenue result.
In light of this, it's curious that Inspired's P/S sits in line with the majority of other companies. It may be that most investors aren't convinced the company can achieve future growth expectations.
The Key Takeaway
Generally, our preference is to limit the use of the price-to-sales ratio to establishing what the market thinks about the overall health of a company.
Looking at Inspired's analyst forecasts revealed that its superior revenue outlook isn't giving the boost to its P/S that we would've expected. When we see a strong revenue outlook, with growth outpacing the industry, we can only assume potential uncertainty around these figures are what might be placing slight pressure on the P/S ratio. At least the risk of a price drop looks to be subdued, but investors seem to think future revenue could see some volatility.
You should always think about risks. Case in point, we've spotted 8 warning signs for Inspired you should be aware of, and 2 of them don't sit too well with us.
Of course, profitable companies with a history of great earnings growth are generally safer bets. So you may wish to see this free collection of other companies that have reasonable P/E ratios and have grown earnings strongly.
Have feedback on this article? Concerned about the content? Get in touch with us directly. Alternatively, email editorial-team (at) simplywallst.com.
This article by Simply Wall St is general in nature. We provide commentary based on historical data and analyst forecasts only using an unbiased methodology and our articles are not intended to be financial advice. It does not constitute a recommendation to buy or sell any stock, and does not take account of your objectives, or your financial situation. We aim to bring you long-term focused analysis driven by fundamental data. Note that our analysis may not factor in the latest price-sensitive company announcements or qualitative material. Simply Wall St has no position in any stocks mentioned.
