
 Yahoo Finance
 Investors in Frasers Group (LON:FRAS) have seen strong returns of 179% over the past five years
It hasn't been the best quarter for Frasers Group Plc (LON:FRAS) shareholders, since the share price has fallen 13% in that time. But that scarcely detracts from the really solid long term returns generated by the company over five years. It's fair to say most would be happy with 179% the gain in that time. We think it's more important to dwell on the long term returns than the short term returns. Only time will tell if there is still too much optimism currently reflected in the share price.
Now it's worth having a look at the company's fundamentals too, because that will help us determine if the long term shareholder return has matched the performance of the underlying business.
Check out our latest analysis for Frasers Group
To paraphrase Benjamin Graham: Over the short term the market is a voting machine, but over the long term it's a weighing machine. One imperfect but simple way to consider how the market perception of a company has shifted is to compare the change in the earnings per share (EPS) with the share price movement.
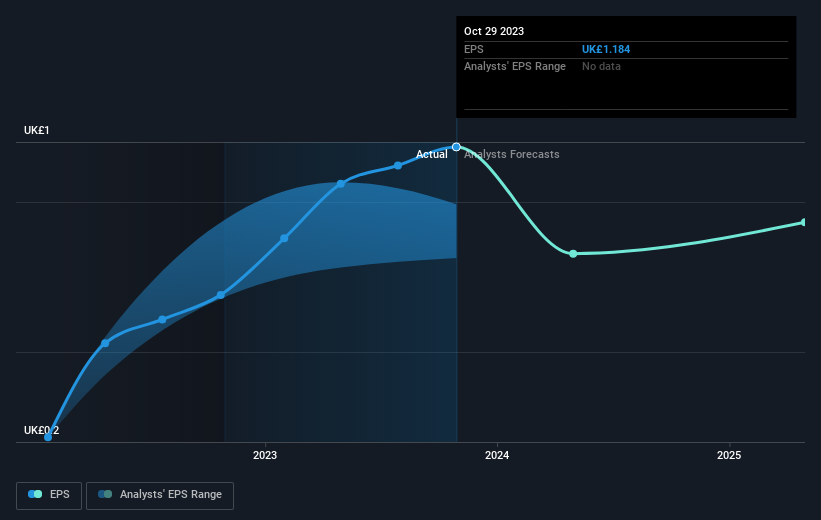
During five years of share price growth, Frasers Group achieved compound earnings per share (EPS) growth of 75% per year. The EPS growth is more impressive than the yearly share price gain of 23% over the same period. So it seems the market isn't so enthusiastic about the stock these days. The reasonably low P/E ratio of 6.55 also suggests market apprehension.
The graphic below depicts how EPS has changed over time (unveil the exact values by clicking on the image).
We know that Frasers Group has improved its bottom line over the last three years, but what does the future have in store? If you are thinking of buying or selling Frasers Group stock, you should check out this FREE detailed report on its balance sheet.
A Different Perspective
It's nice to see that Frasers Group shareholders have received a total shareholder return of 9.8% over the last year. However, the TSR over five years, coming in at 23% per year, is even more impressive. The pessimistic view would be that be that the stock has its best days behind it, but on the other hand the price might simply be moderating while the business itself continues to execute. I find it very interesting to look at share price over the long term as a proxy for business performance. But to truly gain insight, we need to consider other information, too. To that end, you should learn about the 3 warning signs we've spotted with Frasers Group (including 1 which shouldn't be ignored) .
If you are like me, then you will not want to miss this free list of growing companies that insiders are buying.
Please note, the market returns quoted in this article reflect the market weighted average returns of stocks that currently trade on British exchanges.
Have feedback on this article? Concerned about the content? Get in touch with us directly. Alternatively, email editorial-team (at) simplywallst.com.
This article by Simply Wall St is general in nature. We provide commentary based on historical data and analyst forecasts only using an unbiased methodology and our articles are not intended to be financial advice. It does not constitute a recommendation to buy or sell any stock, and does not take account of your objectives, or your financial situation. We aim to bring you long-term focused analysis driven by fundamental data. Note that our analysis may not factor in the latest price-sensitive company announcements or qualitative material. Simply Wall St has no position in any stocks mentioned.
