
 Yahoo Finance
 Investors Shouldn't Overlook The Favourable Returns On Capital At Parex Resources (TSE:PXT)
Did you know there are some financial metrics that can provide clues of a potential multi-bagger? In a perfect world, we'd like to see a company investing more capital into its business and ideally the returns earned from that capital are also increasing. If you see this, it typically means it's a company with a great business model and plenty of profitable reinvestment opportunities. So, when we ran our eye over Parex Resources' (TSE:PXT) trend of ROCE, we really liked what we saw.
Understanding Return On Capital Employed (ROCE)
If you haven't worked with ROCE before, it measures the 'return' (pre-tax profit) a company generates from capital employed in its business. The formula for this calculation on Parex Resources is:
Return on Capital Employed = Earnings Before Interest and Tax (EBIT) ÷ (Total Assets - Current Liabilities)
0.29 = US$568m ÷ (US$2.3b - US$298m) (Based on the trailing twelve months to September 2023).
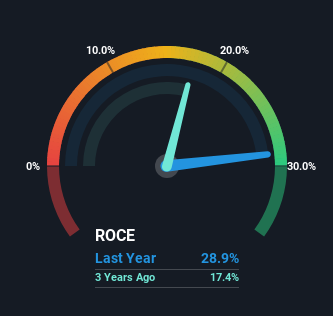
Thus, Parex Resources has an ROCE of 29%. In absolute terms that's a great return and it's even better than the Oil and Gas industry average of 9.8%.
View our latest analysis for Parex Resources
Above you can see how the current ROCE for Parex Resources compares to its prior returns on capital, but there's only so much you can tell from the past. If you'd like to see what analysts are forecasting going forward, you should check out our free analyst report for Parex Resources .
What The Trend Of ROCE Can Tell Us
In terms of Parex Resources' history of ROCE, it's quite impressive. The company has consistently earned 29% for the last five years, and the capital employed within the business has risen 53% in that time. With returns that high, it's great that the business can continually reinvest its money at such appealing rates of return. If Parex Resources can keep this up, we'd be very optimistic about its future.
One more thing to note, even though ROCE has remained relatively flat over the last five years, the reduction in current liabilities to 13% of total assets, is good to see from a business owner's perspective. Effectively suppliers now fund less of the business, which can lower some elements of risk.
The Bottom Line
In the end, the company has proven it can reinvest it's capital at high rates of returns, which you'll remember is a trait of a multi-bagger. In light of this, the stock has only gained 17% over the last five years for shareholders who have owned the stock in this period. That's why it could be worth your time looking into this stock further to discover if it has more traits of a multi-bagger.
One more thing: We've identified 2 warning signs with Parex Resources (at least 1 which shouldn't be ignored) , and understanding them would certainly be useful.
Parex Resources is not the only stock earning high returns. If you'd like to see more, check out our free list of companies earning high returns on equity with solid fundamentals.
Have feedback on this article? Concerned about the content? Get in touch with us directly. Alternatively, email editorial-team (at) simplywallst.com.
This article by Simply Wall St is general in nature. We provide commentary based on historical data and analyst forecasts only using an unbiased methodology and our articles are not intended to be financial advice. It does not constitute a recommendation to buy or sell any stock, and does not take account of your objectives, or your financial situation. We aim to bring you long-term focused analysis driven by fundamental data. Note that our analysis may not factor in the latest price-sensitive company announcements or qualitative material. Simply Wall St has no position in any stocks mentioned.
