
 Yahoo Finance
 Investors in Teekay (NYSE:TK) have seen stellar returns of 115% over the past three years
It hasn't been the best quarter for Teekay Corporation (NYSE:TK) shareholders, since the share price has fallen 17% in that time. But in three years the returns have been great. Indeed, the share price is up a very strong 115% in that time. After a run like that some may not be surprised to see prices moderate. If the business can perform well for years to come, then the recent drop could be an opportunity.
Now it's worth having a look at the company's fundamentals too, because that will help us determine if the long term shareholder return has matched the performance of the underlying business.
See our latest analysis for Teekay
While markets are a powerful pricing mechanism, share prices reflect investor sentiment, not just underlying business performance. One flawed but reasonable way to assess how sentiment around a company has changed is to compare the earnings per share (EPS) with the share price.
During three years of share price growth, Teekay moved from a loss to profitability. That kind of transition can be an inflection point that justifies a strong share price gain, just as we have seen here.
You can see below how EPS has changed over time (discover the exact values by clicking on the image).
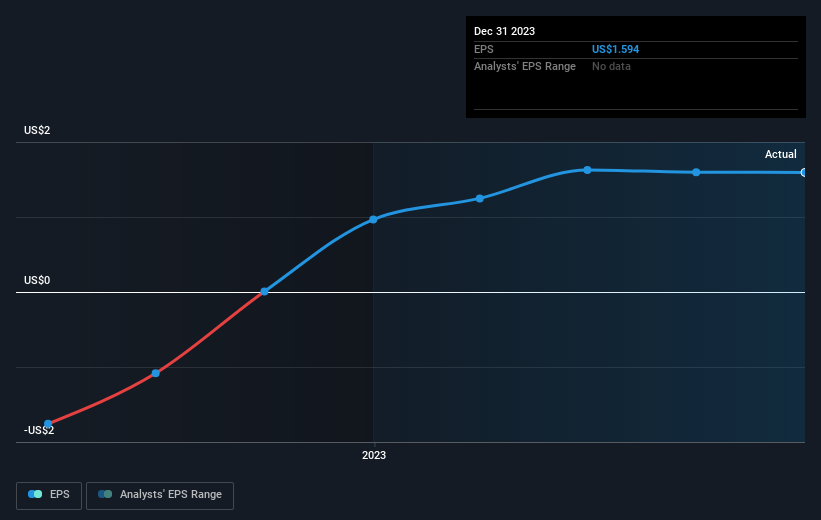
Dive deeper into Teekay's key metrics by checking this interactive graph of Teekay's earnings, revenue and cash flow.
A Different Perspective
It's nice to see that Teekay shareholders have received a total shareholder return of 36% over the last year. Since the one-year TSR is better than the five-year TSR (the latter coming in at 11% per year), it would seem that the stock's performance has improved in recent times. Someone with an optimistic perspective could view the recent improvement in TSR as indicating that the business itself is getting better with time. Shareholders might want to examine this detailed historical graph of past earnings, revenue and cash flow.
But note: Teekay may not be the best stock to buy. So take a peek at this free list of interesting companies with past earnings growth (and further growth forecast).
Please note, the market returns quoted in this article reflect the market weighted average returns of stocks that currently trade on American exchanges.
Have feedback on this article? Concerned about the content? Get in touch with us directly. Alternatively, email editorial-team (at) simplywallst.com.
This article by Simply Wall St is general in nature. We provide commentary based on historical data and analyst forecasts only using an unbiased methodology and our articles are not intended to be financial advice. It does not constitute a recommendation to buy or sell any stock, and does not take account of your objectives, or your financial situation. We aim to bring you long-term focused analysis driven by fundamental data. Note that our analysis may not factor in the latest price-sensitive company announcements or qualitative material. Simply Wall St has no position in any stocks mentioned.
