
 Yahoo Finance
 Return Trends At NextEra Energy (NYSE:NEE) Aren't Appealing
Did you know there are some financial metrics that can provide clues of a potential multi-bagger? Typically, we'll want to notice a trend of growing return on capital employed (ROCE) and alongside that, an expanding base of capital employed. Basically this means that a company has profitable initiatives that it can continue to reinvest in, which is a trait of a compounding machine. Having said that, from a first glance at NextEra Energy (NYSE:NEE) we aren't jumping out of our chairs at how returns are trending, but let's have a deeper look.
Return On Capital Employed (ROCE): What Is It?
Just to clarify if you're unsure, ROCE is a metric for evaluating how much pre-tax income (in percentage terms) a company earns on the capital invested in its business. To calculate this metric for NextEra Energy, this is the formula:
Return on Capital Employed = Earnings Before Interest and Tax (EBIT) ÷ (Total Assets - Current Liabilities)
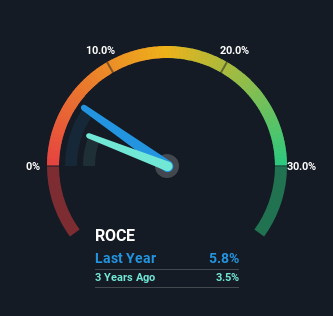
0.058 = US$9.1b ÷ (US$180b - US$25b) (Based on the trailing twelve months to March 2024).
Therefore, NextEra Energy has an ROCE of 5.8%. On its own that's a low return, but compared to the average of 4.7% generated by the Electric Utilities industry, it's much better.
View our latest analysis for NextEra Energy
In the above chart we have measured NextEra Energy's prior ROCE against its prior performance, but the future is arguably more important. If you'd like to see what analysts are forecasting going forward, you should check out our free analyst report for NextEra Energy .
The Trend Of ROCE
There are better returns on capital out there than what we're seeing at NextEra Energy. The company has employed 70% more capital in the last five years, and the returns on that capital have remained stable at 5.8%. Given the company has increased the amount of capital employed, it appears the investments that have been made simply don't provide a high return on capital.
What We Can Learn From NextEra Energy's ROCE
In conclusion, NextEra Energy has been investing more capital into the business, but returns on that capital haven't increased. Since the stock has gained an impressive 64% over the last five years, investors must think there's better things to come. Ultimately, if the underlying trends persist, we wouldn't hold our breath on it being a multi-bagger going forward.
If you'd like to know more about NextEra Energy, we've spotted 2 warning signs, and 1 of them doesn't sit too well with us.
While NextEra Energy may not currently earn the highest returns, we've compiled a list of companies that currently earn more than 25% return on equity. Check out this free list here.
Have feedback on this article? Concerned about the content? Get in touch with us directly. Alternatively, email editorial-team (at) simplywallst.com.
This article by Simply Wall St is general in nature. We provide commentary based on historical data and analyst forecasts only using an unbiased methodology and our articles are not intended to be financial advice. It does not constitute a recommendation to buy or sell any stock, and does not take account of your objectives, or your financial situation. We aim to bring you long-term focused analysis driven by fundamental data. Note that our analysis may not factor in the latest price-sensitive company announcements or qualitative material. Simply Wall St has no position in any stocks mentioned.
