
 Yahoo Finance
 The Returns On Capital At Mincon Group (LON:MCON) Don't Inspire Confidence
There are a few key trends to look for if we want to identify the next multi-bagger. Firstly, we'd want to identify a growing return on capital employed (ROCE) and then alongside that, an ever-increasing base of capital employed. Ultimately, this demonstrates that it's a business that is reinvesting profits at increasing rates of return. Although, when we looked at Mincon Group (LON:MCON), it didn't seem to tick all of these boxes.
Return On Capital Employed (ROCE): What Is It?
If you haven't worked with ROCE before, it measures the 'return' (pre-tax profit) a company generates from capital employed in its business. The formula for this calculation on Mincon Group is:
Return on Capital Employed = Earnings Before Interest and Tax (EBIT) ÷ (Total Assets - Current Liabilities)
0.10 = €19m ÷ (€227m - €40m) (Based on the trailing twelve months to June 2023).
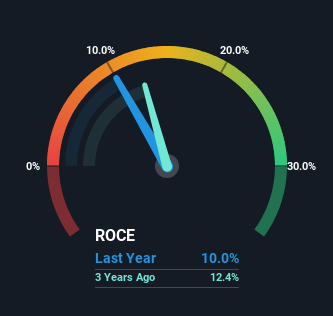
Therefore, Mincon Group has an ROCE of 10%. In isolation, that's a pretty standard return but against the Machinery industry average of 13%, it's not as good.
See our latest analysis for Mincon Group
Above you can see how the current ROCE for Mincon Group compares to its prior returns on capital, but there's only so much you can tell from the past. If you'd like to see what analysts are forecasting going forward, you should check out our free analyst report for Mincon Group .
What Does the ROCE Trend For Mincon Group Tell Us?
On the surface, the trend of ROCE at Mincon Group doesn't inspire confidence. Around five years ago the returns on capital were 13%, but since then they've fallen to 10%. However it looks like Mincon Group might be reinvesting for long term growth because while capital employed has increased, the company's sales haven't changed much in the last 12 months. It's worth keeping an eye on the company's earnings from here on to see if these investments do end up contributing to the bottom line.
The Bottom Line
Bringing it all together, while we're somewhat encouraged by Mincon Group's reinvestment in its own business, we're aware that returns are shrinking. Since the stock has declined 45% over the last five years, investors may not be too optimistic on this trend improving either. Therefore based on the analysis done in this article, we don't think Mincon Group has the makings of a multi-bagger.
If you want to know some of the risks facing Mincon Group we've found 3 warning signs (1 doesn't sit too well with us!) that you should be aware of before investing here.
For those who like to invest in solid companies, check out this free list of companies with solid balance sheets and high returns on equity.
Have feedback on this article? Concerned about the content? Get in touch with us directly. Alternatively, email editorial-team (at) simplywallst.com.
This article by Simply Wall St is general in nature. We provide commentary based on historical data and analyst forecasts only using an unbiased methodology and our articles are not intended to be financial advice. It does not constitute a recommendation to buy or sell any stock, and does not take account of your objectives, or your financial situation. We aim to bring you long-term focused analysis driven by fundamental data. Note that our analysis may not factor in the latest price-sensitive company announcements or qualitative material. Simply Wall St has no position in any stocks mentioned.
