
 Yahoo Finance
 Returns Are Gaining Momentum At Europa Oil & Gas (Holdings) (LON:EOG)
If we want to find a potential multi-bagger, often there are underlying trends that can provide clues. Typically, we'll want to notice a trend of growing return on capital employed (ROCE) and alongside that, an expanding base of capital employed. This shows us that it's a compounding machine, able to continually reinvest its earnings back into the business and generate higher returns. So on that note, Europa Oil & Gas (Holdings) (LON:EOG) looks quite promising in regards to its trends of return on capital.
What Is Return On Capital Employed (ROCE)?
For those who don't know, ROCE is a measure of a company's yearly pre-tax profit (its return), relative to the capital employed in the business. The formula for this calculation on Europa Oil & Gas (Holdings) is:
Return on Capital Employed = Earnings Before Interest and Tax (EBIT) ÷ (Total Assets - Current Liabilities)
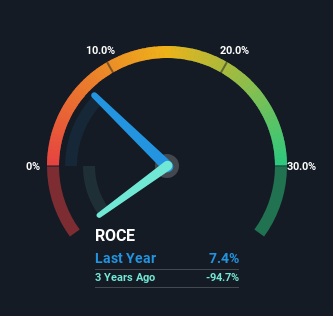
0.074 = UK£1.1m ÷ (UK£16m - UK£781k) (Based on the trailing twelve months to July 2023).
Therefore, Europa Oil & Gas (Holdings) has an ROCE of 7.4%. Ultimately, that's a low return and it under-performs the Oil and Gas industry average of 10%.
Check out our latest analysis for Europa Oil & Gas (Holdings)
While the past is not representative of the future, it can be helpful to know how a company has performed historically, which is why we have this chart above. If you'd like to look at how Europa Oil & Gas (Holdings) has performed in the past in other metrics, you can view this free graph of Europa Oil & Gas (Holdings)'s past earnings, revenue and cash flow.
What Does the ROCE Trend For Europa Oil & Gas (Holdings) Tell Us?
The fact that Europa Oil & Gas (Holdings) is now generating some pre-tax profits from its prior investments is very encouraging. The company was generating losses five years ago, but now it's earning 7.4% which is a sight for sore eyes. In addition to that, Europa Oil & Gas (Holdings) is employing 96% more capital than previously which is expected of a company that's trying to break into profitability. This can indicate that there's plenty of opportunities to invest capital internally and at ever higher rates, both common traits of a multi-bagger.
What We Can Learn From Europa Oil & Gas (Holdings)'s ROCE
Overall, Europa Oil & Gas (Holdings) gets a big tick from us thanks in most part to the fact that it is now profitable and is reinvesting in its business. And since the stock has fallen 67% over the last five years, there might be an opportunity here. So researching this company further and determining whether or not these trends will continue seems justified.
If you'd like to know more about Europa Oil & Gas (Holdings), we've spotted 2 warning signs, and 1 of them is concerning.
If you want to search for solid companies with great earnings, check out this free list of companies with good balance sheets and impressive returns on equity.
Have feedback on this article? Concerned about the content? Get in touch with us directly. Alternatively, email editorial-team (at) simplywallst.com.
This article by Simply Wall St is general in nature. We provide commentary based on historical data and analyst forecasts only using an unbiased methodology and our articles are not intended to be financial advice. It does not constitute a recommendation to buy or sell any stock, and does not take account of your objectives, or your financial situation. We aim to bring you long-term focused analysis driven by fundamental data. Note that our analysis may not factor in the latest price-sensitive company announcements or qualitative material. Simply Wall St has no position in any stocks mentioned.
