
 Yahoo Finance
 Shareholders in Camellia (LON:CAM) are in the red if they invested five years ago
Generally speaking long term investing is the way to go. But unfortunately, some companies simply don't succeed. To wit, the Camellia Plc (LON:CAM) share price managed to fall 58% over five long years. We certainly feel for shareholders who bought near the top.
It's worthwhile assessing if the company's economics have been moving in lockstep with these underwhelming shareholder returns, or if there is some disparity between the two. So let's do just that.
See our latest analysis for Camellia
Given that Camellia didn't make a profit in the last twelve months, we'll focus on revenue growth to form a quick view of its business development. Shareholders of unprofitable companies usually desire strong revenue growth. That's because it's hard to be confident a company will be sustainable if revenue growth is negligible, and it never makes a profit.
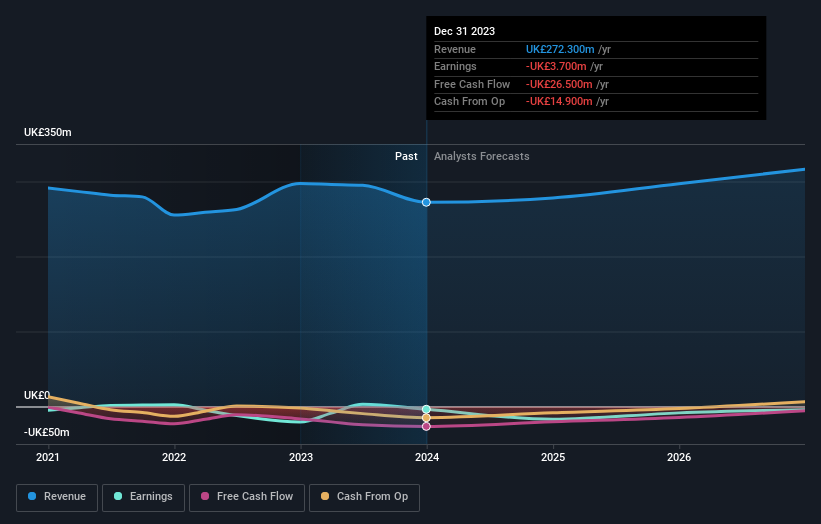
In the last five years Camellia saw its revenue shrink by 1.8% per year. That's not what investors generally want to see. With neither profit nor revenue growth, the loss of 10% per year doesn't really surprise us. We don't think anyone is rushing to buy this stock. Ultimately, it may be worth watching - should revenue pick up, the share price might follow.
You can see how earnings and revenue have changed over time in the image below (click on the chart to see the exact values).
If you are thinking of buying or selling Camellia stock, you should check out this FREE detailed report on its balance sheet.
What About Dividends?
As well as measuring the share price return, investors should also consider the total shareholder return (TSR). The TSR is a return calculation that accounts for the value of cash dividends (assuming that any dividend received was reinvested) and the calculated value of any discounted capital raisings and spin-offs. It's fair to say that the TSR gives a more complete picture for stocks that pay a dividend. In the case of Camellia, it has a TSR of -53% for the last 5 years. That exceeds its share price return that we previously mentioned. This is largely a result of its dividend payments!
A Different Perspective
Investors in Camellia had a tough year, with a total loss of 3.3% (including dividends), against a market gain of about 6.7%. Even the share prices of good stocks drop sometimes, but we want to see improvements in the fundamental metrics of a business, before getting too interested. Unfortunately, longer term shareholders are suffering worse, given the loss of 9% doled out over the last five years. We would want clear information suggesting the company will grow, before taking the view that the share price will stabilize. I find it very interesting to look at share price over the long term as a proxy for business performance. But to truly gain insight, we need to consider other information, too. For instance, we've identified 1 warning sign for Camellia that you should be aware of.
If you like to buy stocks alongside management, then you might just love this free list of companies. (Hint: insiders have been buying them).
Please note, the market returns quoted in this article reflect the market weighted average returns of stocks that currently trade on British exchanges.
Have feedback on this article? Concerned about the content? Get in touch with us directly. Alternatively, email editorial-team (at) simplywallst.com.
This article by Simply Wall St is general in nature. We provide commentary based on historical data and analyst forecasts only using an unbiased methodology and our articles are not intended to be financial advice. It does not constitute a recommendation to buy or sell any stock, and does not take account of your objectives, or your financial situation. We aim to bring you long-term focused analysis driven by fundamental data. Note that our analysis may not factor in the latest price-sensitive company announcements or qualitative material. Simply Wall St has no position in any stocks mentioned.
