
 Yahoo Finance
 Shareholders in Inspired (LON:INSE) are in the red if they invested five years ago
While not a mind-blowing move, it is good to see that the Inspired Plc (LON:INSE) share price has gained 16% in the last three months. But that can't change the reality that over the longer term (five years), the returns have been really quite dismal. In that time the share price has delivered a rude shock to holders, who find themselves down 57% after a long stretch. So we're hesitant to put much weight behind the short term increase. But it could be that the fall was overdone.
It's worthwhile assessing if the company's economics have been moving in lockstep with these underwhelming shareholder returns, or if there is some disparity between the two. So let's do just that.
Check out our latest analysis for Inspired
To quote Buffett, 'Ships will sail around the world but the Flat Earth Society will flourish. There will continue to be wide discrepancies between price and value in the marketplace...' By comparing earnings per share (EPS) and share price changes over time, we can get a feel for how investor attitudes to a company have morphed over time.
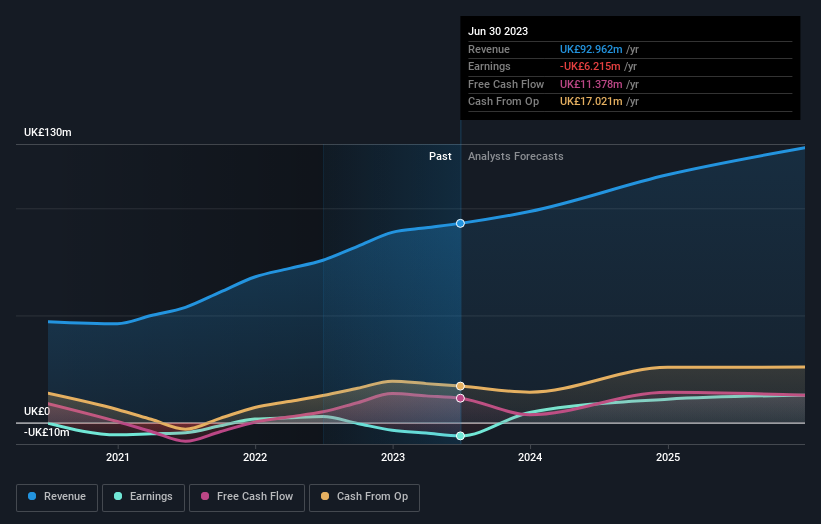
Inspired became profitable within the last five years. However, it made a loss in the last twelve months, suggesting profit may be an unreliable metric at this stage. Other metrics may better explain the share price move.
Revenue is actually up 23% over the time period. A more detailed examination of the revenue and earnings may or may not explain why the share price languishes; there could be an opportunity.
The graphic below depicts how earnings and revenue have changed over time (unveil the exact values by clicking on the image).
Take a more thorough look at Inspired's financial health with this free report on its balance sheet.
What About Dividends?
It is important to consider the total shareholder return, as well as the share price return, for any given stock. Whereas the share price return only reflects the change in the share price, the TSR includes the value of dividends (assuming they were reinvested) and the benefit of any discounted capital raising or spin-off. It's fair to say that the TSR gives a more complete picture for stocks that pay a dividend. We note that for Inspired the TSR over the last 5 years was -52%, which is better than the share price return mentioned above. And there's no prize for guessing that the dividend payments largely explain the divergence!
A Different Perspective
We regret to report that Inspired shareholders are down 19% for the year (even including dividends). Unfortunately, that's worse than the broader market decline of 1.2%. Having said that, it's inevitable that some stocks will be oversold in a falling market. The key is to keep your eyes on the fundamental developments. Unfortunately, last year's performance may indicate unresolved challenges, given that it was worse than the annualised loss of 9% over the last half decade. We realise that Baron Rothschild has said investors should "buy when there is blood on the streets", but we caution that investors should first be sure they are buying a high quality business. I find it very interesting to look at share price over the long term as a proxy for business performance. But to truly gain insight, we need to consider other information, too. For instance, we've identified 4 warning signs for Inspired (1 is significant) that you should be aware of.
Of course Inspired may not be the best stock to buy. So you may wish to see this free collection of growth stocks.
Please note, the market returns quoted in this article reflect the market weighted average returns of stocks that currently trade on British exchanges.
Have feedback on this article? Concerned about the content? Get in touch with us directly. Alternatively, email editorial-team (at) simplywallst.com.
This article by Simply Wall St is general in nature. We provide commentary based on historical data and analyst forecasts only using an unbiased methodology and our articles are not intended to be financial advice. It does not constitute a recommendation to buy or sell any stock, and does not take account of your objectives, or your financial situation. We aim to bring you long-term focused analysis driven by fundamental data. Note that our analysis may not factor in the latest price-sensitive company announcements or qualitative material. Simply Wall St has no position in any stocks mentioned.
