
 Yahoo Finance
 Shareholders in St Barbara (ASX:SBM) are in the red if they invested five years ago
It is doubtless a positive to see that the St Barbara Limited (ASX:SBM) share price has gained some 65% in the last three months. But spare a thought for the long term holders, who have held the stock as it bled value over the last five years. In fact, the share price has tumbled down a mountain to land 91% lower after that period. While the recent increase might be a green shoot, we're certainly hesitant to rejoice. The real question is whether the business can leave its past behind and improve itself over the years ahead. We really feel for shareholders in this scenario. It's a good reminder of the importance of diversification, and it's worth keeping in mind there's more to life than money, anyway.
With that in mind, it's worth seeing if the company's underlying fundamentals have been the driver of long term performance, or if there are some discrepancies.
View our latest analysis for St Barbara
St Barbara wasn't profitable in the last twelve months, it is unlikely we'll see a strong correlation between its share price and its earnings per share (EPS). Arguably revenue is our next best option. Generally speaking, companies without profits are expected to grow revenue every year, and at a good clip. Some companies are willing to postpone profitability to grow revenue faster, but in that case one would hope for good top-line growth to make up for the lack of earnings.
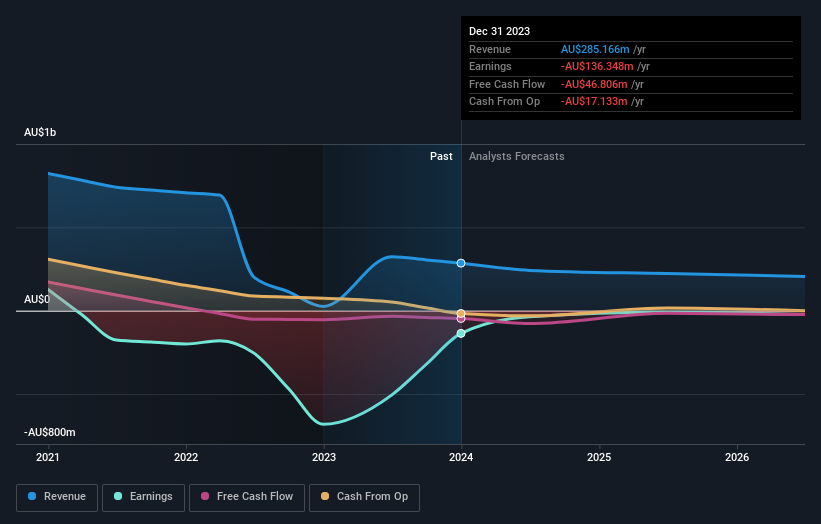
Over half a decade St Barbara reduced its trailing twelve month revenue by 20% for each year. That's definitely a weaker result than most pre-profit companies report. So it's not that strange that the share price dropped 14% per year in that period. We don't think this is a particularly promising picture. Ironically, that behavior could create an opportunity for the contrarian investor - but only if there are good reasons to predict a brighter future.
You can see how earnings and revenue have changed over time in the image below (click on the chart to see the exact values).
You can see how its balance sheet has strengthened (or weakened) over time in this free interactive graphic.
What About The Total Shareholder Return (TSR)?
We've already covered St Barbara's share price action, but we should also mention its total shareholder return (TSR). Arguably the TSR is a more complete return calculation because it accounts for the value of dividends (as if they were reinvested), along with the hypothetical value of any discounted capital that have been offered to shareholders. St Barbara's TSR of was a loss of 77% for the 5 years. That wasn't as bad as its share price return, because it has paid dividends.
A Different Perspective
St Barbara shareholders are up 7.2% for the year. But that return falls short of the market. But at least that's still a gain! Over five years the TSR has been a reduction of 12% per year, over five years. It could well be that the business is stabilizing. It's always interesting to track share price performance over the longer term. But to understand St Barbara better, we need to consider many other factors. Even so, be aware that St Barbara is showing 1 warning sign in our investment analysis , you should know about...
But note: St Barbara may not be the best stock to buy. So take a peek at this free list of interesting companies with past earnings growth (and further growth forecast).
Please note, the market returns quoted in this article reflect the market weighted average returns of stocks that currently trade on Australian exchanges.
Have feedback on this article? Concerned about the content? Get in touch with us directly. Alternatively, email editorial-team (at) simplywallst.com.
This article by Simply Wall St is general in nature. We provide commentary based on historical data and analyst forecasts only using an unbiased methodology and our articles are not intended to be financial advice. It does not constitute a recommendation to buy or sell any stock, and does not take account of your objectives, or your financial situation. We aim to bring you long-term focused analysis driven by fundamental data. Note that our analysis may not factor in the latest price-sensitive company announcements or qualitative material. Simply Wall St has no position in any stocks mentioned.
