
 Yahoo Finance
 Be Wary Of Siltronic (ETR:WAF) And Its Returns On Capital
To find a multi-bagger stock, what are the underlying trends we should look for in a business? In a perfect world, we'd like to see a company investing more capital into its business and ideally the returns earned from that capital are also increasing. Put simply, these types of businesses are compounding machines, meaning they are continually reinvesting their earnings at ever-higher rates of return. Although, when we looked at Siltronic (ETR:WAF), it didn't seem to tick all of these boxes.
What Is Return On Capital Employed (ROCE)?
For those that aren't sure what ROCE is, it measures the amount of pre-tax profits a company can generate from the capital employed in its business. To calculate this metric for Siltronic, this is the formula:
Return on Capital Employed = Earnings Before Interest and Tax (EBIT) ÷ (Total Assets - Current Liabilities)
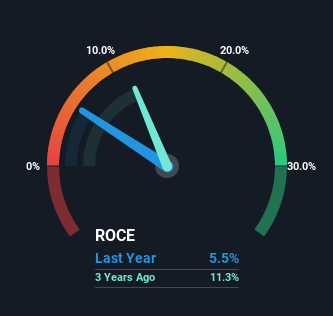
0.055 = €213m ÷ (€4.5b - €638m) (Based on the trailing twelve months to December 2023).
Therefore, Siltronic has an ROCE of 5.5%. In absolute terms, that's a low return and it also under-performs the Semiconductor industry average of 16%.
View our latest analysis for Siltronic
Above you can see how the current ROCE for Siltronic compares to its prior returns on capital, but there's only so much you can tell from the past. If you're interested, you can view the analysts predictions in our free analyst report for Siltronic .
What Does the ROCE Trend For Siltronic Tell Us?
When we looked at the ROCE trend at Siltronic, we didn't gain much confidence. To be more specific, ROCE has fallen from 31% over the last five years. Given the business is employing more capital while revenue has slipped, this is a bit concerning. This could mean that the business is losing its competitive advantage or market share, because while more money is being put into ventures, it's actually producing a lower return - "less bang for their buck" per se.
The Bottom Line On Siltronic's ROCE
From the above analysis, we find it rather worrisome that returns on capital and sales for Siltronic have fallen, meanwhile the business is employing more capital than it was five years ago. In spite of that, the stock has delivered a 7.8% return to shareholders who held over the last five years. Either way, we aren't huge fans of the current trends and so with that we think you might find better investments elsewhere.
Siltronic does have some risks, we noticed 3 warning signs (and 2 which shouldn't be ignored) we think you should know about.
While Siltronic may not currently earn the highest returns, we've compiled a list of companies that currently earn more than 25% return on equity. Check out this free list here.
Have feedback on this article? Concerned about the content? Get in touch with us directly. Alternatively, email editorial-team (at) simplywallst.com.
This article by Simply Wall St is general in nature. We provide commentary based on historical data and analyst forecasts only using an unbiased methodology and our articles are not intended to be financial advice. It does not constitute a recommendation to buy or sell any stock, and does not take account of your objectives, or your financial situation. We aim to bring you long-term focused analysis driven by fundamental data. Note that our analysis may not factor in the latest price-sensitive company announcements or qualitative material. Simply Wall St has no position in any stocks mentioned.
