Advertisement
UK markets closed
  • FTSE 100

    8,139.83
    +60.97 (+0.75%)
     
  • FTSE 250

    19,824.16
    +222.18 (+1.13%)
     
  • AIM

    755.28
    +2.16 (+0.29%)
     
  • GBP/EUR

    1.1680
    +0.0024 (+0.20%)
     
  • GBP/USD

    1.2493
    -0.0018 (-0.15%)
     
  • Bitcoin GBP

    51,251.21
    -471.44 (-0.91%)
     
  • CMC Crypto 200

    1,332.11
    -64.42 (-4.61%)
     
  • S&P 500

    5,108.66
    +60.24 (+1.19%)
     
  • DOW

    38,320.71
    +234.91 (+0.62%)
     
  • CRUDE OIL

    83.80
    +0.23 (+0.28%)
     
  • GOLD FUTURES

    2,350.50
    +8.00 (+0.34%)
     
  • NIKKEI 225

    37,934.76
    +306.28 (+0.81%)
     
  • HANG SENG

    17,651.15
    +366.61 (+2.12%)
     
  • DAX

    18,161.01
    +243.73 (+1.36%)
     
  • CAC 40

    8,088.24
    +71.59 (+0.89%)
     

How PPL’s Current Valuation Compares to Its Peers
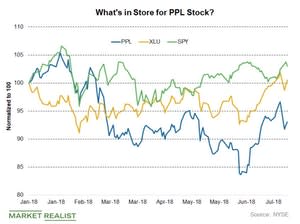
How PPL’s Current Valuation Compares to Its Peers

PPL Corporation (PPL) stock is trading at a PE multiple of 13x compared to its five-year historical average of 14x. It recently traded at an enterprise-value-to-EBITDA multiple of 9.7x. Its five-year historical average is 11x. So PPL seems to be trading at a discounted valuation to its historical multiples.