
 Yahoo Finance
 The 112% return delivered to NACCO Industries' (NYSE:NC) shareholders actually lagged YoY earnings growth
The most you can lose on any stock (assuming you don't use leverage) is 100% of your money. But when you pick a company that is really flourishing, you can make more than 100%. For example, the NACCO Industries, Inc. (NYSE:NC) share price has soared 108% in the last 1 year. Most would be very happy with that, especially in just one year! On top of that, the share price is up 22% in about a quarter. Unfortunately the longer term returns are not so good, with the stock falling 4.9% in the last three years.
Since the stock has added US$47m to its market cap in the past week alone, let's see if underlying performance has been driving long-term returns.
Check out our latest analysis for NACCO Industries
There is no denying that markets are sometimes efficient, but prices do not always reflect underlying business performance. By comparing earnings per share (EPS) and share price changes over time, we can get a feel for how investor attitudes to a company have morphed over time.
During the last year NACCO Industries grew its earnings per share (EPS) by 348%. This EPS growth is significantly higher than the 108% increase in the share price. Therefore, it seems the market isn't as excited about NACCO Industries as it was before. This could be an opportunity. This cautious sentiment is reflected in its (fairly low) P/E ratio of 4.80.
The company's earnings per share (over time) is depicted in the image below (click to see the exact numbers).
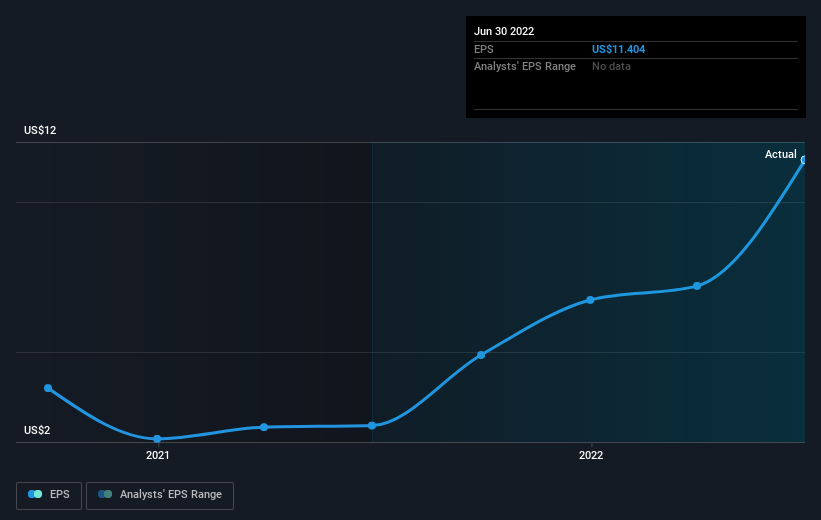
This free interactive report on NACCO Industries' earnings, revenue and cash flow is a great place to start, if you want to investigate the stock further.
What About Dividends?
As well as measuring the share price return, investors should also consider the total shareholder return (TSR). The TSR incorporates the value of any spin-offs or discounted capital raisings, along with any dividends, based on the assumption that the dividends are reinvested. So for companies that pay a generous dividend, the TSR is often a lot higher than the share price return. As it happens, NACCO Industries' TSR for the last 1 year was 112%, which exceeds the share price return mentioned earlier. The dividends paid by the company have thusly boosted the total shareholder return.
A Different Perspective
It's good to see that NACCO Industries has rewarded shareholders with a total shareholder return of 112% in the last twelve months. Of course, that includes the dividend. Since the one-year TSR is better than the five-year TSR (the latter coming in at 3% per year), it would seem that the stock's performance has improved in recent times. Someone with an optimistic perspective could view the recent improvement in TSR as indicating that the business itself is getting better with time. It's always interesting to track share price performance over the longer term. But to understand NACCO Industries better, we need to consider many other factors. To that end, you should be aware of the 2 warning signs we've spotted with NACCO Industries .
Of course NACCO Industries may not be the best stock to buy. So you may wish to see this free collection of growth stocks.
Please note, the market returns quoted in this article reflect the market weighted average returns of stocks that currently trade on US exchanges.
Have feedback on this article? Concerned about the content? Get in touch with us directly. Alternatively, email editorial-team (at) simplywallst.com.
This article by Simply Wall St is general in nature. We provide commentary based on historical data and analyst forecasts only using an unbiased methodology and our articles are not intended to be financial advice. It does not constitute a recommendation to buy or sell any stock, and does not take account of your objectives, or your financial situation. We aim to bring you long-term focused analysis driven by fundamental data. Note that our analysis may not factor in the latest price-sensitive company announcements or qualitative material. Simply Wall St has no position in any stocks mentioned.
Join A Paid User Research Session
You’ll receive a US$30 Amazon Gift card for 1 hour of your time while helping us build better investing tools for the individual investors like yourself. Sign up here
