
 Yahoo Finance
 With A -122.89% Earnings Drop, Is Investment Technology Group Inc’s (NYSE:ITG) A Concern?

Understanding how Investment Technology Group Inc (NYSE:ITG) is performing as a company requires looking at more than just a years’ earnings. Today I will run you through a basic sense check to gain perspective on how Investment Technology Group is doing by comparing its latest earnings with its long-term trend as well as the performance of its capital markets industry peers. View our latest analysis for Investment Technology Group
How Well Did ITG Perform?
I look at the ‘latest twelve-month’ data, which annualizes the latest 6-month earnings release, or some times, the latest annual report is already the most recent financial data. This blend allows me to examine different stocks in a uniform manner using the most relevant data points. For Investment Technology Group, its most recent earnings (trailing twelve month) is -US$40.36M, which, in comparison to last year’s level, has become more negative. Since these values may be relatively short-term thinking, I have created an annualized five-year figure for Investment Technology Group’s net income, which stands at -US$43.62M. This means that, though net income is negative, it has become less negative over the years.
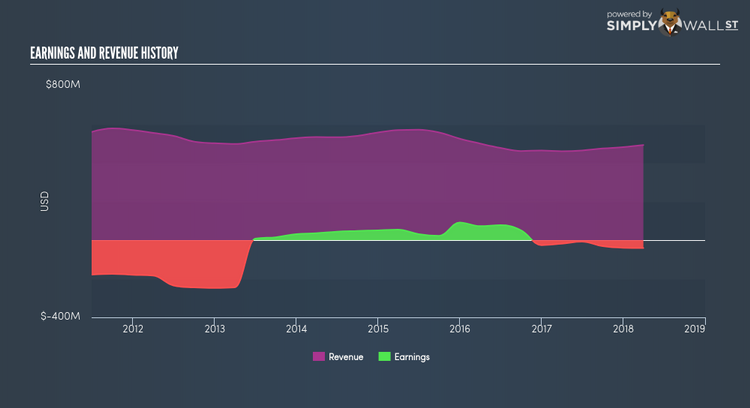
We can further analyze Investment Technology Group’s loss by looking at what the industry has been experiencing over the past few years. Each year, for the past five years Investment Technology Group has seen an annual decline in revenue of -2.33%, on average. This adverse movement is a driver of the company’s inability to reach breakeven. Has the entire industry experienced this headwind? Inspecting growth from a sector-level, the US capital markets industry has been growing its average earnings by double-digit 14.49% over the previous year, and 12.80% over the past half a decade. This means whatever uplift the industry is deriving benefit from, Investment Technology Group has not been able to gain as much as its industry peers.
What does this mean?
Though Investment Technology Group’s past data is helpful, it is only one aspect of my investment thesis. With companies that are currently loss-making, it is always difficult to forecast what will occur going forward, and when. The most valuable step is to examine company-specific issues Investment Technology Group may be facing and whether management guidance has steadily been met in the past. You should continue to research Investment Technology Group to get a more holistic view of the stock by looking at:
Financial Health: Is ITG’s operations financially sustainable? Balance sheets can be hard to analyze, which is why we’ve done it for you. Check out our financial health checks here.
Other High-Performing Stocks: Are there other stocks that provide better prospects with proven track records? Explore our free list of these great stocks here.
NB: Figures in this article are calculated using data from the trailing twelve months from 31 March 2018. This may not be consistent with full year annual report figures.
To help readers see pass the short term volatility of the financial market, we aim to bring you a long-term focused research analysis purely driven by fundamental data. Note that our analysis does not factor in the latest price sensitive company announcements.
The author is an independent contributor and at the time of publication had no position in the stocks mentioned.
