
 Yahoo Finance
 With 16% Earnings Growth, Did Burberry Group plc (LON:BRBY) Outperform The Industry?

When Burberry Group plc (LSE:BRBY) announced its most recent earnings (30 March 2019), I compared it against two factor: its historical earnings track record, and the performance of its industry peers on average. Being able to interpret how well Burberry Group has done so far requires weighing its performance against a benchmark, rather than looking at a standalone number at a point in time. In this article, I've summarized the key takeaways on how I see BRBY has performed.
See our latest analysis for Burberry Group
Did BRBY's recent earnings growth beat the long-term trend and the industry?
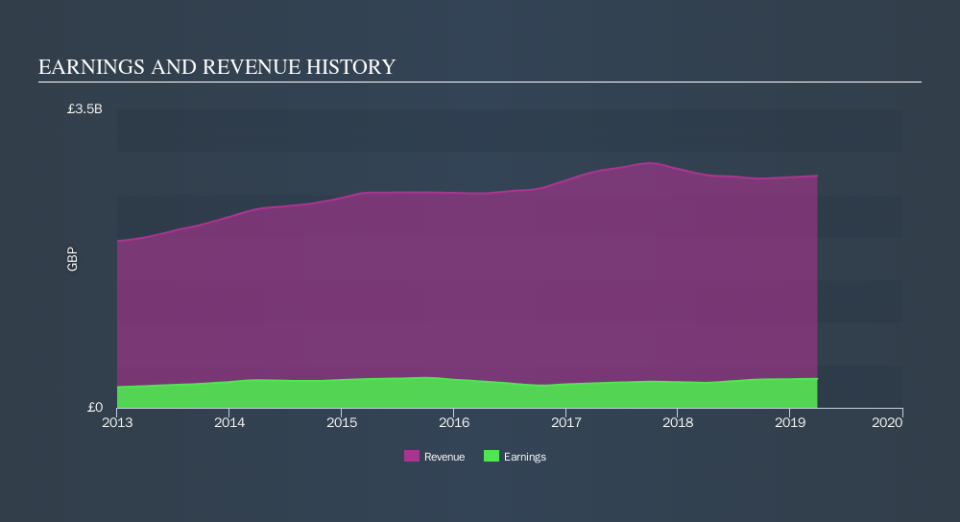
BRBY's trailing twelve-month earnings (from 30 March 2019) of UK£339m has jumped 16% compared to the previous year.
Furthermore, this one-year growth rate has exceeded its 5-year annual growth average of -0.7%, indicating the rate at which BRBY is growing has accelerated. What's the driver of this growth? Let's see if it is solely because of industry tailwinds, or if Burberry Group has experienced some company-specific growth.
In terms of returns from investment, Burberry Group has invested its equity funds well leading to a 23% return on equity (ROE), above the sensible minimum of 20%. Furthermore, its return on assets (ROA) of 14% exceeds the GB Luxury industry of 5.3%, indicating Burberry Group has used its assets more efficiently. And finally, its return on capital (ROC), which also accounts for Burberry Group’s debt level, has increased over the past 3 years from 23% to 26%. This correlates with a decrease in debt holding, with debt-to-equity ratio declining from 12% to 2.5% over the past 5 years.
What does this mean?
While past data is useful, it doesn’t tell the whole story. Companies that have performed well in the past, such as Burberry Group gives investors conviction. However, the next step would be to assess whether the future looks as optimistic. I suggest you continue to research Burberry Group to get a better picture of the stock by looking at:
Future Outlook: What are well-informed industry analysts predicting for BRBY’s future growth? Take a look at our free research report of analyst consensus for BRBY’s outlook.
Financial Health: Are BRBY’s operations financially sustainable? Balance sheets can be hard to analyze, which is why we’ve done it for you. Check out our financial health checks here.
Other High-Performing Stocks: Are there other stocks that provide better prospects with proven track records? Explore our free list of these great stocks here.
NB: Figures in this article are calculated using data from the trailing twelve months from 30 March 2019. This may not be consistent with full year annual report figures.
We aim to bring you long-term focused research analysis driven by fundamental data. Note that our analysis may not factor in the latest price-sensitive company announcements or qualitative material.
If you spot an error that warrants correction, please contact the editor at editorial-team@simplywallst.com. This article by Simply Wall St is general in nature. It does not constitute a recommendation to buy or sell any stock, and does not take account of your objectives, or your financial situation. Simply Wall St has no position in the stocks mentioned. Thank you for reading.
