
 Yahoo Finance
 2.4% earnings growth over 5 years has not materialized into gains for Criteo (NASDAQ:CRTO) shareholders over that period
We think intelligent long term investing is the way to go. But no-one is immune from buying too high. For example, after five long years the Criteo S.A. (NASDAQ:CRTO) share price is a whole 57% lower. That is extremely sub-optimal, to say the least. And some of the more recent buyers are probably worried, too, with the stock falling 48% in the last year. Furthermore, it's down 16% in about a quarter. That's not much fun for holders. However, one could argue that the price has been influenced by the general market, which is down 15% in the same timeframe.
After losing 11% this past week, it's worth investigating the company's fundamentals to see what we can infer from past performance.
See our latest analysis for Criteo
To paraphrase Benjamin Graham: Over the short term the market is a voting machine, but over the long term it's a weighing machine. One flawed but reasonable way to assess how sentiment around a company has changed is to compare the earnings per share (EPS) with the share price.
While the share price declined over five years, Criteo actually managed to increase EPS by an average of 13% per year. Given the share price reaction, one might suspect that EPS is not a good guide to the business performance during the period (perhaps due to a one-off loss or gain). Alternatively, growth expectations may have been unreasonable in the past.
Due to the lack of correlation between the EPS growth and the falling share price, it's worth taking a look at other metrics to try to understand the share price movement.
Revenue is actually up 0.1% over the time period. So it seems one might have to take closer look at the fundamentals to understand why the share price languishes. After all, there may be an opportunity.
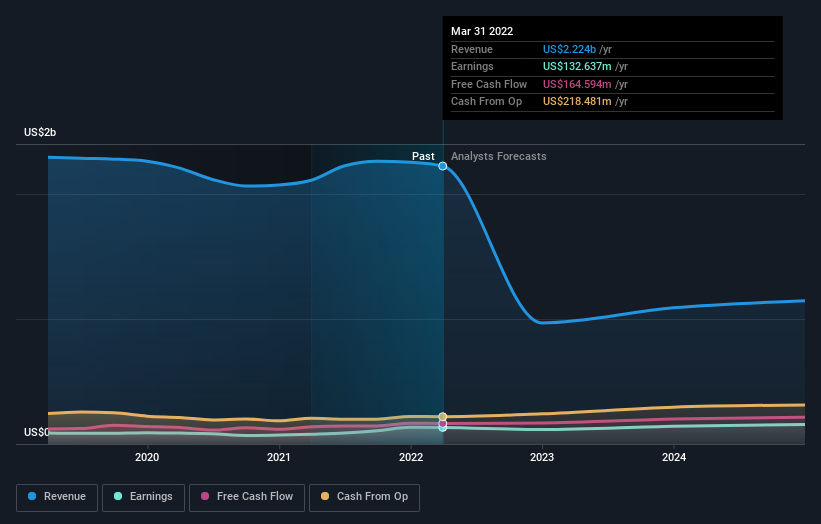
The graphic below depicts how earnings and revenue have changed over time (unveil the exact values by clicking on the image).
Criteo is a well known stock, with plenty of analyst coverage, suggesting some visibility into future growth. So we recommend checking out this free report showing consensus forecasts
A Different Perspective
While the broader market lost about 18% in the twelve months, Criteo shareholders did even worse, losing 48%. However, it could simply be that the share price has been impacted by broader market jitters. It might be worth keeping an eye on the fundamentals, in case there's a good opportunity. Unfortunately, last year's performance may indicate unresolved challenges, given that it was worse than the annualised loss of 10% over the last half decade. Generally speaking long term share price weakness can be a bad sign, though contrarian investors might want to research the stock in hope of a turnaround. I find it very interesting to look at share price over the long term as a proxy for business performance. But to truly gain insight, we need to consider other information, too. For example, we've discovered 1 warning sign for Criteo that you should be aware of before investing here.
Of course, you might find a fantastic investment by looking elsewhere. So take a peek at this free list of companies we expect will grow earnings.
Please note, the market returns quoted in this article reflect the market weighted average returns of stocks that currently trade on US exchanges.
Have feedback on this article? Concerned about the content? Get in touch with us directly. Alternatively, email editorial-team (at) simplywallst.com.
This article by Simply Wall St is general in nature. We provide commentary based on historical data and analyst forecasts only using an unbiased methodology and our articles are not intended to be financial advice. It does not constitute a recommendation to buy or sell any stock, and does not take account of your objectives, or your financial situation. We aim to bring you long-term focused analysis driven by fundamental data. Note that our analysis may not factor in the latest price-sensitive company announcements or qualitative material. Simply Wall St has no position in any stocks mentioned.
Join A Paid User Research Session
You’ll receive a US$30 Amazon Gift card for 1 hour of your time while helping us build better investing tools for the individual investors like yourself. Sign up here
