
 Yahoo Finance
 We Like 2 Cheap Cars Group's (NZSE:2CC) Returns And Here's How They're Trending
If we want to find a stock that could multiply over the long term, what are the underlying trends we should look for? Firstly, we'd want to identify a growing return on capital employed (ROCE) and then alongside that, an ever-increasing base of capital employed. Ultimately, this demonstrates that it's a business that is reinvesting profits at increasing rates of return. Speaking of which, we noticed some great changes in 2 Cheap Cars Group's (NZSE:2CC) returns on capital, so let's have a look.
Return On Capital Employed (ROCE): What Is It?
For those who don't know, ROCE is a measure of a company's yearly pre-tax profit (its return), relative to the capital employed in the business. Analysts use this formula to calculate it for 2 Cheap Cars Group:
Return on Capital Employed = Earnings Before Interest and Tax (EBIT) ÷ (Total Assets - Current Liabilities)
0.36 = NZ$9.4m ÷ (NZ$34m - NZ$8.4m) (Based on the trailing twelve months to March 2024).
Therefore, 2 Cheap Cars Group has an ROCE of 36%. In absolute terms that's a great return and it's even better than the Specialty Retail industry average of 17%.
Check out our latest analysis for 2 Cheap Cars Group
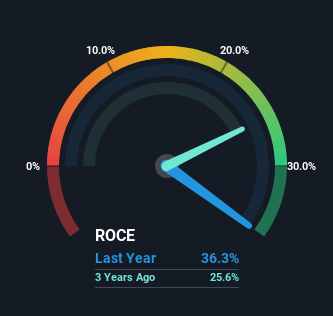
Historical performance is a great place to start when researching a stock so above you can see the gauge for 2 Cheap Cars Group's ROCE against it's prior returns. If you're interested in investigating 2 Cheap Cars Group's past further, check out this free graph covering 2 Cheap Cars Group's past earnings, revenue and cash flow.
How Are Returns Trending?
The trends we've noticed at 2 Cheap Cars Group are quite reassuring. Over the last three years, returns on capital employed have risen substantially to 36%. Basically the business is earning more per dollar of capital invested and in addition to that, 26% more capital is being employed now too. The increasing returns on a growing amount of capital is common amongst multi-baggers and that's why we're impressed.
One more thing to note, 2 Cheap Cars Group has decreased current liabilities to 24% of total assets over this period, which effectively reduces the amount of funding from suppliers or short-term creditors. So this improvement in ROCE has come from the business' underlying economics, which is great to see.
The Bottom Line
A company that is growing its returns on capital and can consistently reinvest in itself is a highly sought after trait, and that's what 2 Cheap Cars Group has. Since the total return from the stock has been almost flat over the last three years, there might be an opportunity here if the valuation looks good. So researching this company further and determining whether or not these trends will continue seems justified.
If you want to continue researching 2 Cheap Cars Group, you might be interested to know about the 2 warning signs that our analysis has discovered.
If you want to search for more stocks that have been earning high returns, check out this free list of stocks with solid balance sheets that are also earning high returns on equity.
Have feedback on this article? Concerned about the content? Get in touch with us directly. Alternatively, email editorial-team (at) simplywallst.com.
This article by Simply Wall St is general in nature. We provide commentary based on historical data and analyst forecasts only using an unbiased methodology and our articles are not intended to be financial advice. It does not constitute a recommendation to buy or sell any stock, and does not take account of your objectives, or your financial situation. We aim to bring you long-term focused analysis driven by fundamental data. Note that our analysis may not factor in the latest price-sensitive company announcements or qualitative material. Simply Wall St has no position in any stocks mentioned.
Have feedback on this article? Concerned about the content? Get in touch with us directly. Alternatively, email editorial-team@simplywallst.com
