
 Yahoo Finance
 2 Facts About High-Yield Dividend Stocks Every Investor Should Know
Most investors buy high-yield dividend stocks because they want the larger income stream these companies provide. However, that bigger cash payout isn't the only benefit of high-yield stocks. Two others are that they tend to generate higher total returns and aren't as volatile as other stocks. Those two facts make them ideal investment options for all investors, even younger ones focused on growth.
1. High-yield stocks are more likely to outperform most other stocks
Wellington Management conducted a study of dividend-paying stocks dating all the way back to 1929. It broke them out into five groups by their dividend payout ratios. The first one had the stocks with the highest payout ratios -- 70% on average -- while the fifth grouping had those with the lowest payout ratios. Given that stocks with higher payout ratios tend to have the highest yields, this research is a good proxy for how high-yield stocks performed over that time frame.
Image source: Getty Images.
Overall, the research showed that stocks in the first group outperformed the S&P 500 77.8% of the time while those in the second group beat the market 88.9% of the time. Meanwhile, those in the third, fourth, and fifth groupings came out ahead of the S&P 500 55.6%, 33.3%, and 44.4% of the time. In other words, stocks with higher payout ratios (and therefore higher yields) tended to outperform the market more often. One reason for this is that dividend payments make up a significant portion of the market's total return. In fact, over the last 80 years, dividends have accounted for 43% of the S&P 500's total return.
To put the power of a high-yield stock into perspective, we'll look back at the returns of pipeline giant ONEOK (NYSE: OKE) over the past decade. As the following chart shows, ONEOK's dividend yield has been well above the average of the S&P 500 during the last 10 years.
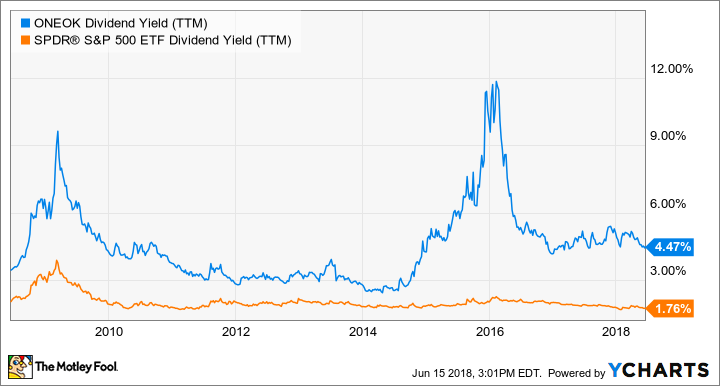
OKE Dividend Yield (TTM) data by YCharts.
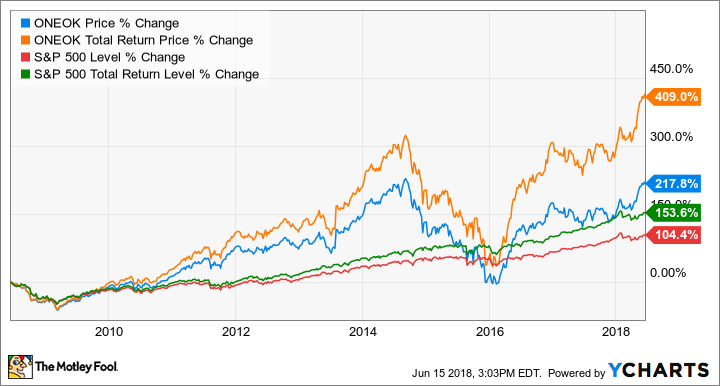
That above-average dividend has enabled ONEOK's investors to earn outsized returns over that time frame. As this next chart shows, ONEOK's total returns have crushed those of the market over that period:
2. High-yield stocks are less volatile than other stocks
Ned Davis Research conducted a similar study on dividend-paying stocks. One of the key findings was that dividend growth stocks tended not only to outperform non-dividend paying stocks but did so with less volatility. Since 1972, Ned Davis Research found that companies that consistently increased their dividend generated total annual returns of 9.89% and had a beta of 0.87, meaning they were only 87% as volatile as stocks in the S&P 500. Non-dividend payers, on the other hand, generated a total annual return of 2.39% on average and had a beta of 1.29 times, implying that they were more volatile than the S&P 500. In the meantime, even stocks that didn't grow their dividend (which can be the case for some higher-yielding stocks) tended to outperform their nonpaying peers with less volatility.
Another way to calculate volatility is the standard deviation, which measures how far data disperses from the mean. For simplicity's sake, the greater this percentage, the more volatile the stock. S&P Global has tracked the relationship between volatility and high-yielding stocks via the S&P Global 1200 Low Volatility High Dividend Index. This index consists of about 100 stocks that have an average yield of 4.7%. For the last decade, the standard deviation of the S&P 1200 Low Volatility High Dividend Index was 14.7% while the S&P 1200's standard deviation was 16.4%. Not only have these stocks proven to be less volatility but this index generated a total annual return of 6.99%, which outperformed the 5.96% total annual return of the S&P Global 1200 index.
A case of having your cake and eating it, too
There's a misconception among investors that high-yield stocks are just for those near or in retirement. The facts, however, suggest otherwise because high-yielding stocks tend to outperform their non-paying peers and do so with less volatility. Because of that, they make great core investments to generate wealth over the long term.
More From The Motley Fool
Matthew DiLallo has no position in any of the stocks mentioned. The Motley Fool owns shares of ONEOK. The Motley Fool has a disclosure policy.
