
 Yahoo Finance
 25 Cities Where Average Americans Are Under the Most Financial Stress
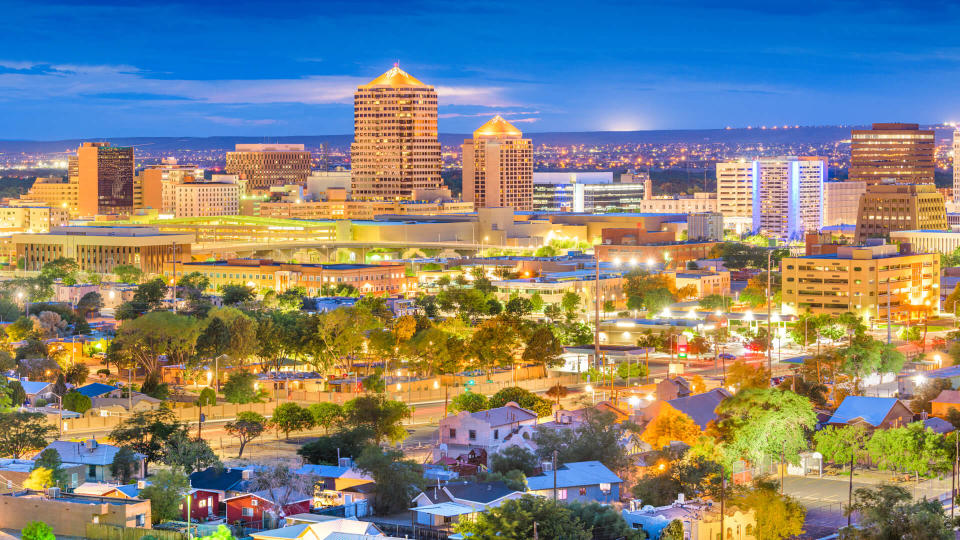
Times are tough for American families, and have been for some time. The middle class may seem like the most insulated, as they are the ones who make between two-thirds to double the national median income. However, even average Americans are feeling the pain of the economic ripple effects that followed the pandemic into the United States’ current state of high inflation.
Find Out: What the Upper Middle Class Make in Different US Cities
Up Next: Become a Real Estate Investor for Just $1K Using This Bezos-Backed Startup
To find the 25 cities where average Americans are under the greatest amount of financial stress, GOBankingRates analyzed the top 150 cities in the United States by population, as sourced from the U.S. Census 2022 American Community Survey. GOBankingRates then found data for a number of key factors such as household income, unemployment rates and the number of households that are spending more than 35% of their monthly income on housing costs. Data was tracked over a three-year period from 2019 to 2022.
Here’s a look at the cities where average American families are the most cost-burdened — and some of them may be surprising.
25. Plano, Texas
Unemployment rate: 3.27%
Poverty rate: 6.94%
Cost-burdened households: 35.27%
Three-year change in income: $10,077
Three-year change in poverty rate: 0.17%
See More: Don’t Buy a House in These 5 US Cities That Have Shrinking Populations and Fewer Buyers
Election Year: 5 Changes That Could Be Coming for the Middle Class If Biden Is Reelected in 2024
Wealthy people know the best money secrets. Learn how to copy them.

24. Chesapeake, Virginia
Unemployment rate: 2.23%
Poverty rate: 7.64%
Cost-burdened households: 54.96%
Three-year change in income: $14,063
Three-year change in poverty rate: -0.93%
For You: Here’s How Much the Definition of Middle Class Has Changed in Every State
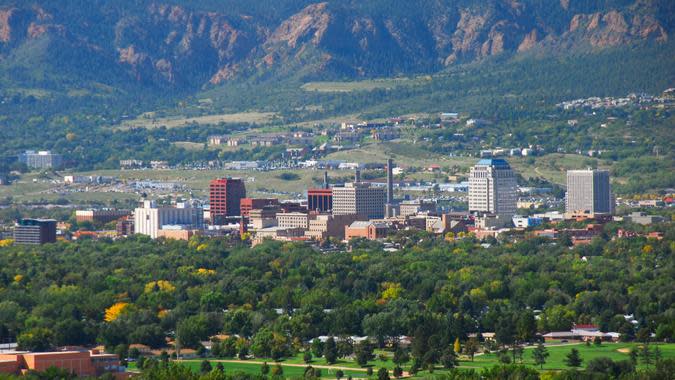
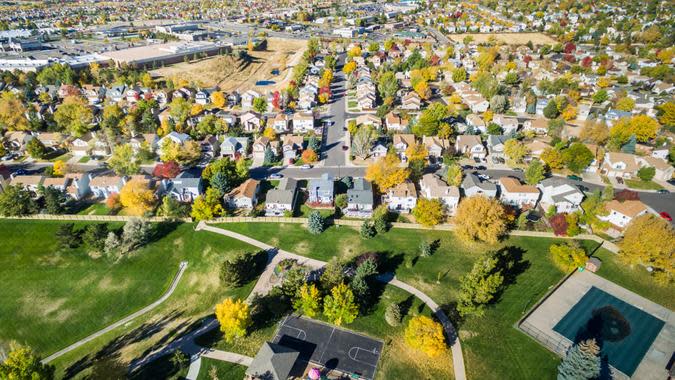
23. Colorado Springs, Colorado
Unemployment rate: 3.51%
Poverty rate: 10.41%
Cost-burdened households: 43.49%
Three-year change in income: $14,314
Three-year change in poverty rate: -1.24%
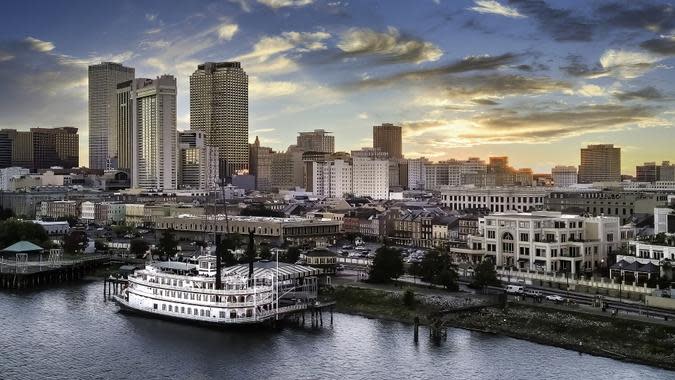
22. New Orleans
Unemployment rate: 4.15%
Poverty rate: 22.92%
Cost-burdened households: 26.71%
Three-year change in income: $9,512
Three-year change in poverty rate: -0.73%
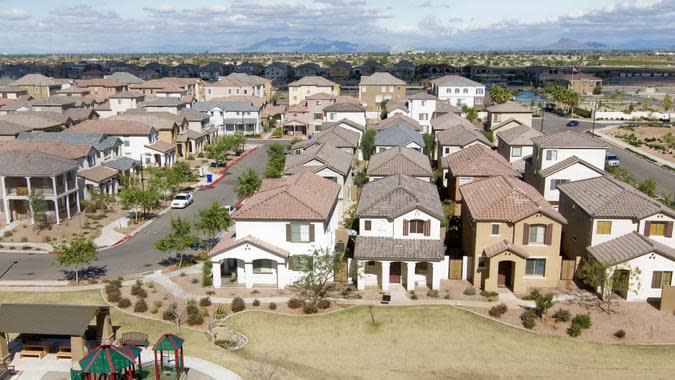
21. Chandler, Arizona
Unemployment rate: 2.98%
Poverty rate: 7.75%
Cost-burdened households: 47.44%
Three-year change in income: $16,449
Three-year change in poverty rate: 0.14%
Check Out: 6 Reasons the Poor Stay Poor and Middle Class Doesn’t Become Wealthy
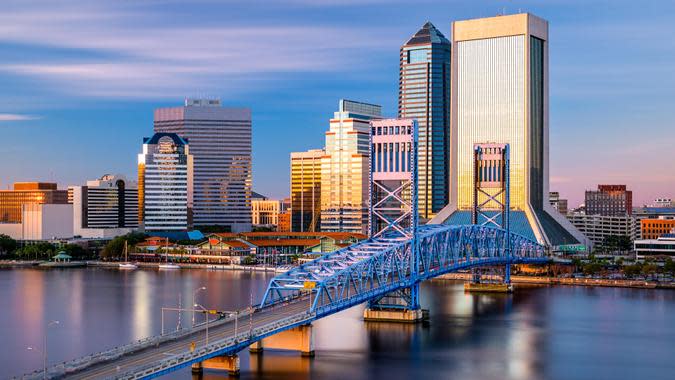
20. Jacksonville, Florida
Unemployment rate: 2.83%
Poverty rate: 14.77%
Cost-burdened households: 36.98%
Three-year change in income: $9,437
Three-year change in poverty rate: -0.10%
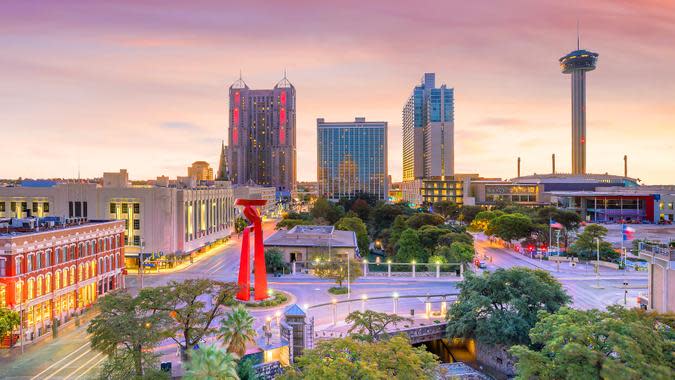
19. San Antonio, Texas
Unemployment rate: 3.35%
Poverty rate: 17.72%
Cost-burdened households: 29.11%
Three-year change in income: $7,138
Three-year change in poverty rate: -0.05%
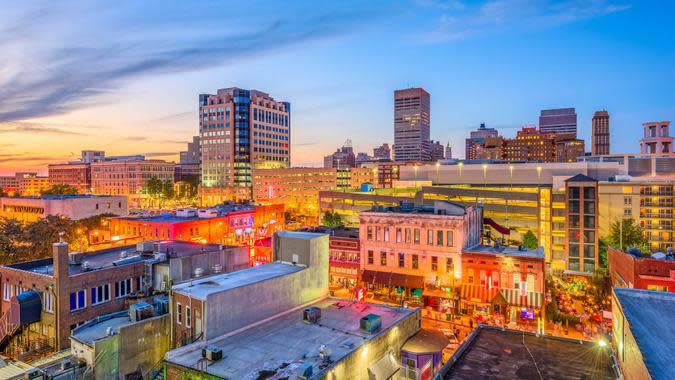
18. Memphis, Tennessee
Unemployment rate: 4.36%
Poverty rate: 23.60%
Cost-burdened households: 27.29%
Three-year change in income: $6,862
Three-year change in poverty rate: -1.51%
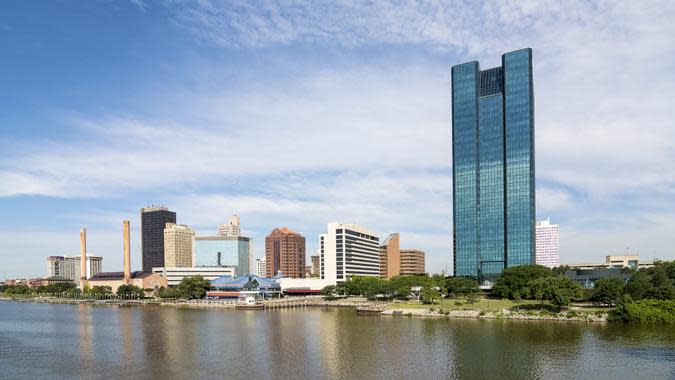
17. Toledo, Ohio
Unemployment rate: 3.77%
Poverty rate: 24.56%
Cost-burdened households: 29.20%
Three-year change in income: $7,653
Three-year change in poverty rate: -0.89%
Discover More: Here’s the Living Wage a Single Person Needs To Live Comfortably in Arizona
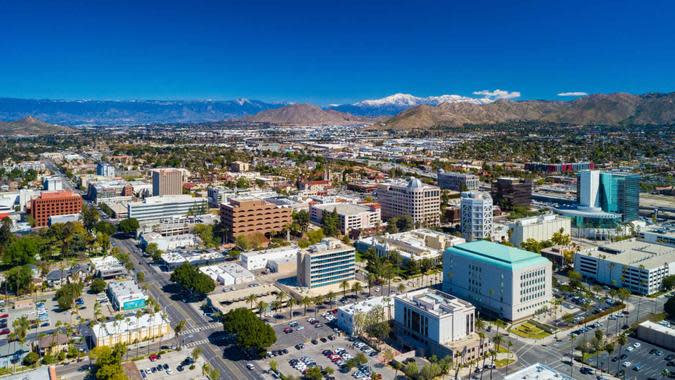
16. Riverside, California
Unemployment rate: 4.23%
Poverty rate: 12.75%
Cost-burdened households: 40.50%
Three-year change in income: $14,403
Three-year change in poverty rate: -1.17%
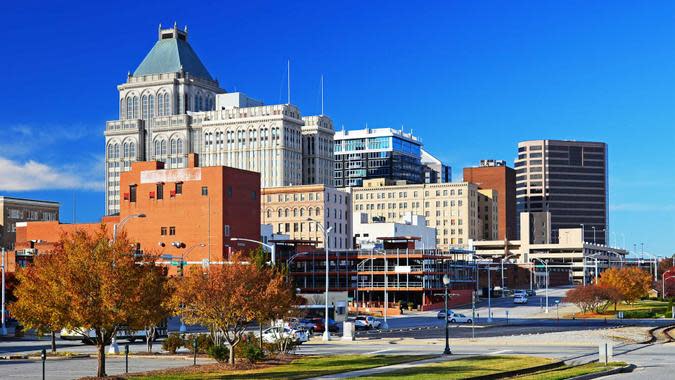
15. Greensboro, North Carolina
Unemployment rate: 3.18%
Poverty rate: 18.05%
Cost-burdened households: 33.10%
Three-year change in income: $6,087
Three-year change in poverty rate: -0.42%
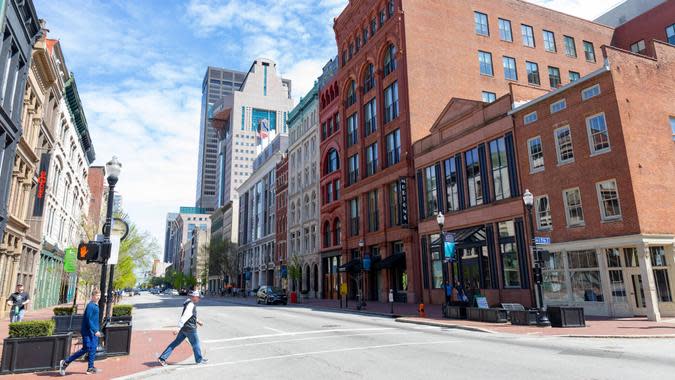
14. Louisville, Kentucky
Unemployment rate: 3.03%
Poverty rate: 15.65%
Cost-burdened households: 39.24%
Three-year change in income: $9,678
Three-year change in poverty rate: -0.28%
13. Fort Wayne, Indiana
Unemployment rate: 3.17%
Poverty rate: 15.16%
Cost-burdened households: 40.31%
Three-year change in income: $8,822
Three-year change in poverty rate: -0.80%
12. Aurora, Colorado
Unemployment rate: 3.05%
Poverty rate: 10.47%
Cost-burdened households: 47.34%
Three-year change in income: $13,585
Three-year change in poverty rate: -0.28%
11. Gilbert, Arizona
Unemployment rate: 2.75%
Poverty rate: 5.51%
Cost-burdened households: 58.42%
Three-year change in income: $18,322
Three-year change in poverty rate: 0.22%
Learn More: Housing Market 2024: 50 Most Affordable Cities for Homebuyers
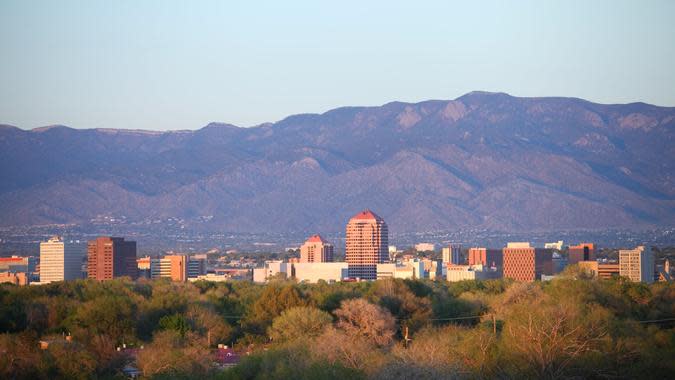
10. Albuquerque, New Mexico
Unemployment rate: 3.44%
Poverty rate: 16.46%
Cost-burdened households: 39.36%
Three-year change in income: $8,592
Three-year change in poverty rate: -0.40%
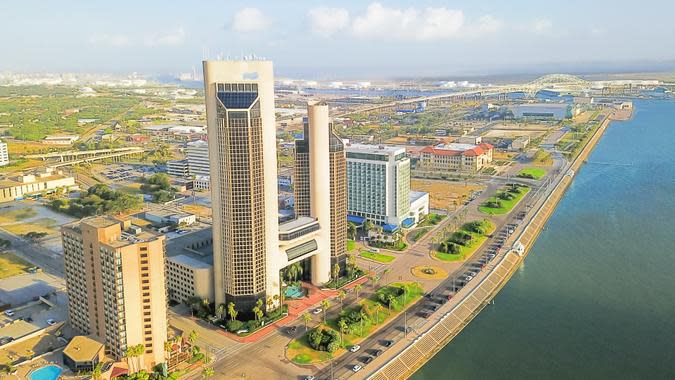
9. Corpus Christie, Texas
Unemployment rate: 3.32%
Poverty rate: 17.28%
Cost-burdened households: 31.43%
Three-year change in income: 1.16%
Three-year change in poverty rate: $8,116
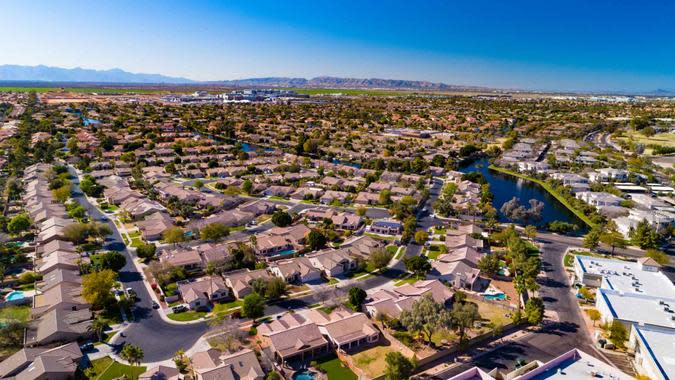
8. Henderson, Nevada
Unemployment rate: 3.27%
Poverty rate: 8.14%
Cost-burdened households: 45.01%
Three-year change in income: $11,164
Three-year change in poverty rate: 0.20%
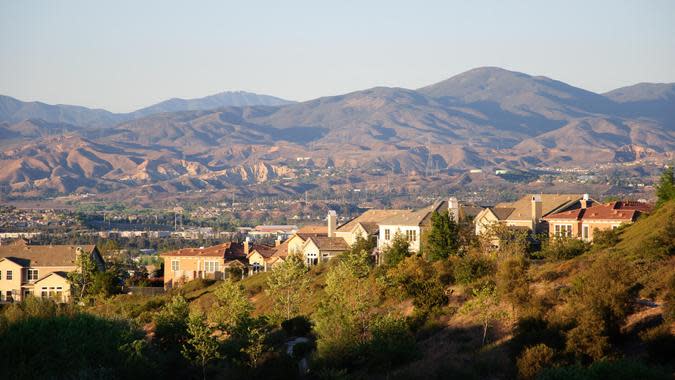
7. Santa Clarita, California
Unemployment rate: 3.77%
Poverty rate: 7.97%
Cost-burdened households: 54.58%
Three-year change in income: $16,520
Three-year change in poverty rate: -0.24%
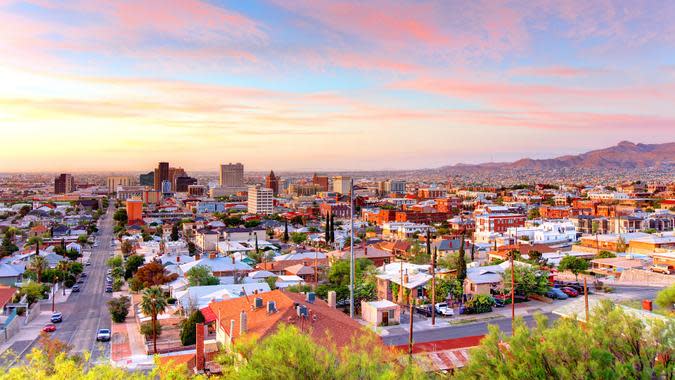
6. El Paso, Texas
Unemployment rate: 4.07%
Poverty rate: 18.94%
Cost-burdened households: 32.46%
Three-year change in income: -0.15%
Three-year change in poverty rate: $8,142
Watch Out: 10 Dangerous Cities You Shouldn’t Buy a Home in No Matter the Price
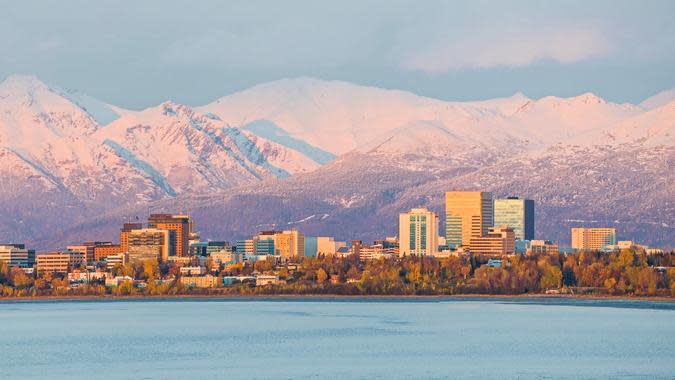
5. Anchorage, Alaska
Unemployment rate: 3.59%
Poverty rate: 9.64%
Cost-burdened households: 44.12%
Three-year change in income: 0.61%
Three-year change in poverty rate: $10,803
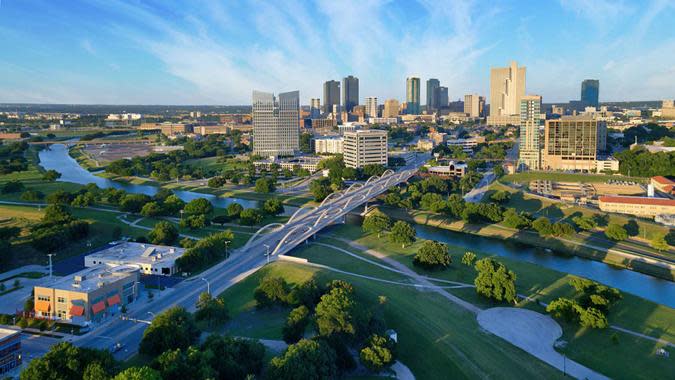
4. Fort Worth, Texas
Unemployment rate: 5.27%
Poverty rate: 13.38%
Cost-burdened households: 36.34%
Three-year change in income: $10,539
Three-year change in poverty rate: -1.11%
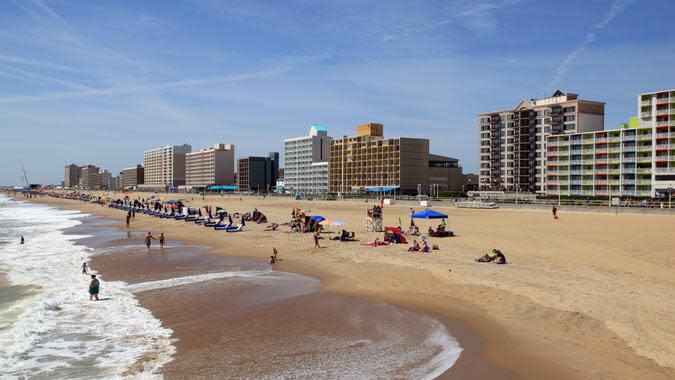
3. Virginia Beach, Virginia
Unemployment rate: 3.19%
Poverty rate: 8.03%
Cost-burdened households: 48.37%
Three-year change in income: $10,934
Three-year change in poverty rate: 0.71%
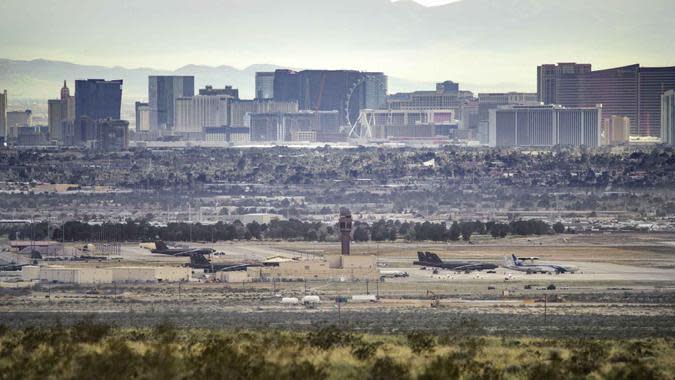
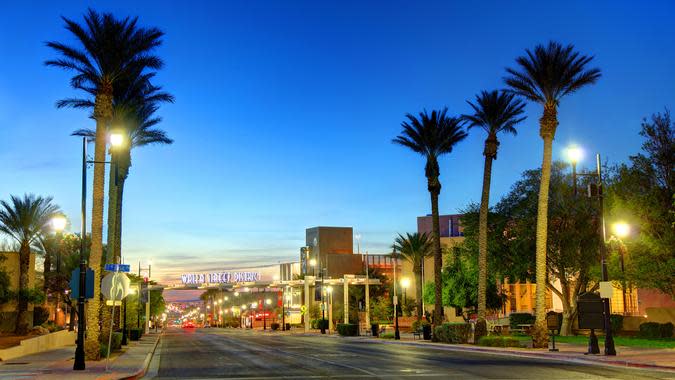
2. Las Vegas
Unemployment rate: 4.85%
Poverty rate: 14.67%
Cost-burdened households: 37.52%
Three-year change in income: $10,002
Three-year change in poverty rate: -0.61%
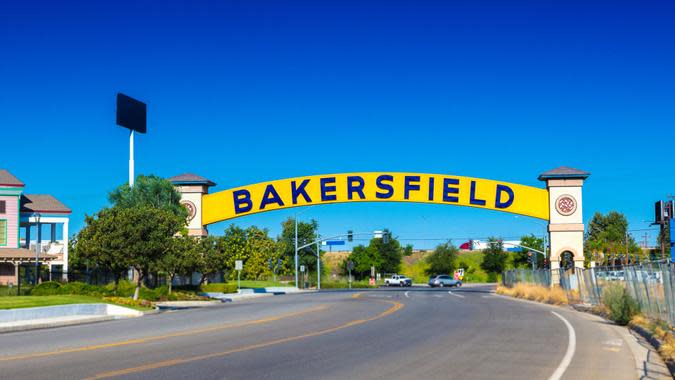
1. Bakersfield, California
Unemployment rate: 4.87%
Poverty rate: 16.53%
Cost-burdened households: 43.61%
Three-year change in income: $10,688
Three-year change in poverty rate: -0.87%
Methodology: For this study, GOBankingRates analyzed the top 150 cities in the United States by population, as sourced from the U.S. Census 2022 American Community Survey S0101. For each city a number of factors were found including; 2022 total households, 2022 and 2019 median household income, sourced from the U.S. Census 2022 and 2019 American Community Survey S1901, the 2022 and 2019 number of unemployed residents as sourced from the US Census 2022 and 2019 American Community Survey DP03, the number of households below the poverty line as sourced from the U.S. Census 2022 and 2019 American Community Survey S1701, and the number of households in 2022 spending more than 35% of their monthly income on housing costs. The poverty rate was calculated using the number of residents below the poverty line and the change from 2019 to 2022 was calculated. The three-year change in median income was calculated from 2019 to 2022. The percentage of households spending more than 35% of their monthly income on housing costs was calculated. The number of households spending more than 35% of their monthly income was scored and weighted at 2.00, the three-year change in household median income was scored and weighted at 1.50, the three-year change in poverty rate was scored and weighted at 2.00, the unemployment rate was scored and weighted at 1.50 and the 2022 household median income was scored and weighted at 1.00. All the scores were summed and sorted to find the cities where the middle-class families are under the most financial stress. All data was collected on and is up to date as of June 11, 2024.
More From GOBankingRates
I'm a Shopping Expert: 6 Things Retirees Should Never Put In Their Grocery Cart
6 Things to Try This Week if You're Behind on Your Savings Goals
4 Reasons Retired Women Need More Money Than Men -- And What To Do About it
This article originally appeared on GOBankingRates.com: 25 Cities Where Average Americans Are Under the Most Financial Stress
