
 Yahoo Finance
 3 Days Left To CME Group Inc (NASDAQ:CME)’s Ex-Dividend Date, Should Investors Buy?

If you are interested in cashing in on CME Group Inc’s (NASDAQ:CME) upcoming dividend of $0.7 per share, you only have 3 days left to buy the shares before its ex-dividend date, 07 June 2018, in time for dividends payable on the 25 June 2018. Is this future income a persuasive enough catalyst for investors to think about CME Group as an investment today? Below, I’m going to look at the latest data and analyze the stock and its dividend property in further detail. Check out our latest analysis for CME Group
Here’s how I find good dividend stocks
When researching a dividend stock, I always follow the following screening criteria:
Is its annual yield among the top 25% of dividend-paying companies?
Has it consistently paid a stable dividend without missing a payment or drastically cutting payout?
Has dividend per share risen in the past couple of years?
Can it afford to pay the current rate of dividends from its earnings?
Based on future earnings growth, will it be able to continue to payout dividend at the current rate?
How does CME Group fare?
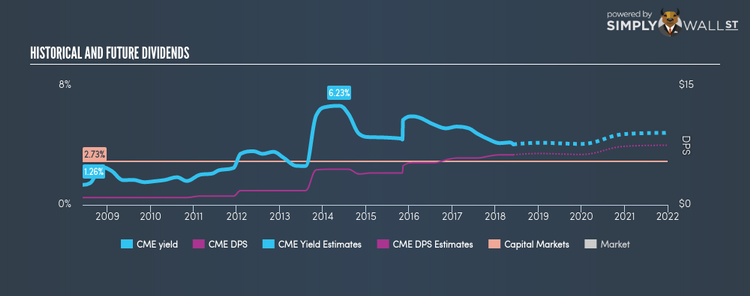
The current trailing twelve-month payout ratio for the stock is 21.31%, which means that the dividend is covered by earnings. In the near future, analysts are predicting a higher payout ratio of 96.04%, leading to a dividend yield of 4.05%. However, EPS is forecasted to fall to $6.73 in the upcoming year. Therefore, although payout is expected to increase, the fall in earnings may not equate to higher dividend income. This also brings about uncertainty around the sustainability of the payout ratio. If there is one thing that you want to be reliable in your life, it’s dividend stocks and their constant income stream. Whilst its per-share payments have increased during the past 10 years, there has been some hiccups. Shareholders would have seen a few years of reduced payments in this time. Relative to peers, CME Group has a yield of 3.81%, which is high for Capital Markets stocks but still below the market’s top dividend payers.
Next Steps:
Whilst there are few things you may like about CME Group from a dividend stock perspective, the truth is that overall it probably is not the best choice for a dividend investor. However, if you are not strictly just a dividend investor, the stock could still offer some interesting investment opportunities. Given that this is purely a dividend analysis, I urge potential investors to try and get a good understanding of the underlying business and its fundamentals before deciding on an investment. There are three relevant factors you should further examine:
Future Outlook: What are well-informed industry analysts predicting for CME’s future growth? Take a look at our free research report of analyst consensus for CME’s outlook.
Valuation: What is CME worth today? Even if the stock is a cash cow, it’s not worth an infinite price. The intrinsic value infographic in our free research report helps visualize whether CME is currently mispriced by the market.
Dividend Rockstars: Are there better dividend payers with stronger fundamentals out there? Check out our free list of these great stocks here.
To help readers see pass the short term volatility of the financial market, we aim to bring you a long-term focused research analysis purely driven by fundamental data. Note that our analysis does not factor in the latest price sensitive company announcements.
The author is an independent contributor and at the time of publication had no position in the stocks mentioned.
