
 Yahoo Finance
 3i Group (LON:III) jumps 7.1% this week, though earnings growth is still tracking behind five-year shareholder returns
3i Group plc (LON:III) shareholders might be concerned after seeing the share price drop 10% in the last quarter. Looking further back, the stock has generated good profits over five years. Its return of 28% has certainly bested the market return!
After a strong gain in the past week, it's worth seeing if longer term returns have been driven by improving fundamentals.
View our latest analysis for 3i Group
While the efficient markets hypothesis continues to be taught by some, it has been proven that markets are over-reactive dynamic systems, and investors are not always rational. One way to examine how market sentiment has changed over time is to look at the interaction between a company's share price and its earnings per share (EPS).
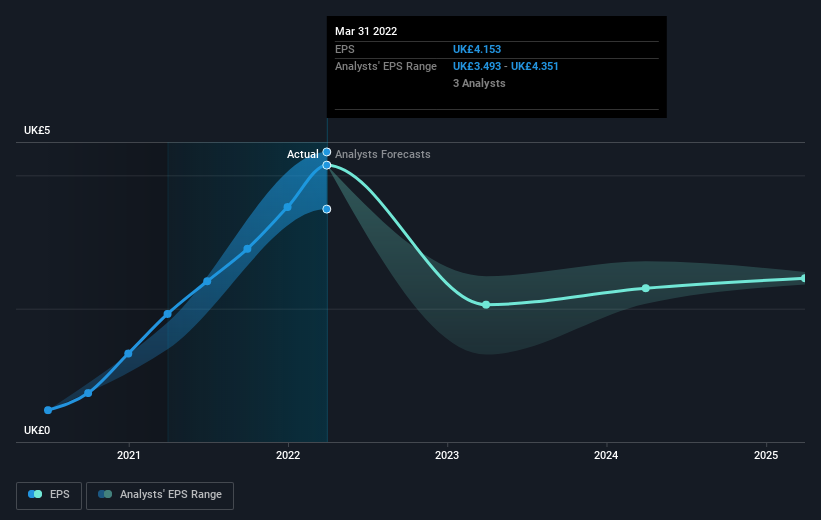
During five years of share price growth, 3i Group achieved compound earnings per share (EPS) growth of 21% per year. This EPS growth is higher than the 5% average annual increase in the share price. So it seems the market isn't so enthusiastic about the stock these days. This cautious sentiment is reflected in its (fairly low) P/E ratio of 2.83.
You can see how EPS has changed over time in the image below (click on the chart to see the exact values).
We like that insiders have been buying shares in the last twelve months. Having said that, most people consider earnings and revenue growth trends to be a more meaningful guide to the business. It might be well worthwhile taking a look at our free report on 3i Group's earnings, revenue and cash flow.
What About Dividends?
It is important to consider the total shareholder return, as well as the share price return, for any given stock. Whereas the share price return only reflects the change in the share price, the TSR includes the value of dividends (assuming they were reinvested) and the benefit of any discounted capital raising or spin-off. Arguably, the TSR gives a more comprehensive picture of the return generated by a stock. As it happens, 3i Group's TSR for the last 5 years was 53%, which exceeds the share price return mentioned earlier. The dividends paid by the company have thusly boosted the total shareholder return.
A Different Perspective
It's good to see that 3i Group has rewarded shareholders with a total shareholder return of 2.2% in the last twelve months. Of course, that includes the dividend. However, that falls short of the 9% TSR per annum it has made for shareholders, each year, over five years. Potential buyers might understandably feel they've missed the opportunity, but it's always possible business is still firing on all cylinders. While it is well worth considering the different impacts that market conditions can have on the share price, there are other factors that are even more important. For instance, we've identified 3 warning signs for 3i Group (2 don't sit too well with us) that you should be aware of.
3i Group is not the only stock that insiders are buying. For those who like to find winning investments this free list of growing companies with recent insider purchasing, could be just the ticket.
Please note, the market returns quoted in this article reflect the market weighted average returns of stocks that currently trade on GB exchanges.
Have feedback on this article? Concerned about the content? Get in touch with us directly. Alternatively, email editorial-team (at) simplywallst.com.
This article by Simply Wall St is general in nature. We provide commentary based on historical data and analyst forecasts only using an unbiased methodology and our articles are not intended to be financial advice. It does not constitute a recommendation to buy or sell any stock, and does not take account of your objectives, or your financial situation. We aim to bring you long-term focused analysis driven by fundamental data. Note that our analysis may not factor in the latest price-sensitive company announcements or qualitative material. Simply Wall St has no position in any stocks mentioned.
Join A Paid User Research Session
You’ll receive a US$30 Amazon Gift card for 1 hour of your time while helping us build better investing tools for the individual investors like yourself. Sign up here
