
 Yahoo Finance
 Is 3M Company's (NYSE:MMM) 39% ROE Better Than Average?
One of the best investments we can make is in our own knowledge and skill set. With that in mind, this article will work through how we can use Return On Equity (ROE) to better understand a business. By way of learning-by-doing, we'll look at ROE to gain a better understanding of 3M Company (NYSE:MMM).
Return on equity or ROE is an important factor to be considered by a shareholder because it tells them how effectively their capital is being reinvested. In short, ROE shows the profit each dollar generates with respect to its shareholder investments.
Check out our latest analysis for 3M
How Is ROE Calculated?
Return on equity can be calculated by using the formula:
Return on Equity = Net Profit (from continuing operations) ÷ Shareholders' Equity
So, based on the above formula, the ROE for 3M is:
39% = US$5.8b ÷ US$15b (Based on the trailing twelve months to December 2022).
The 'return' refers to a company's earnings over the last year. One way to conceptualize this is that for each $1 of shareholders' capital it has, the company made $0.39 in profit.
Does 3M Have A Good Return On Equity?
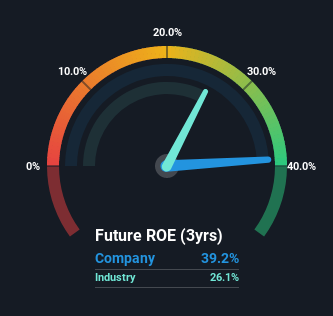
By comparing a company's ROE with its industry average, we can get a quick measure of how good it is. Importantly, this is far from a perfect measure, because companies differ significantly within the same industry classification. As you can see in the graphic below, 3M has a higher ROE than the average (26%) in the Industrials industry.
That's clearly a positive. With that said, a high ROE doesn't always indicate high profitability. A higher proportion of debt in a company's capital structure may also result in a high ROE, where the high debt levels could be a huge risk . Our risks dashboardshould have the 2 risks we have identified for 3M.
The Importance Of Debt To Return On Equity
Companies usually need to invest money to grow their profits. That cash can come from retained earnings, issuing new shares (equity), or debt. In the case of the first and second options, the ROE will reflect this use of cash, for growth. In the latter case, the debt used for growth will improve returns, but won't affect the total equity. In this manner the use of debt will boost ROE, even though the core economics of the business stay the same.
3M's Debt And Its 39% ROE
3M does use a high amount of debt to increase returns. It has a debt to equity ratio of 1.08. While no doubt that its ROE is impressive, we would have been even more impressed had the company achieved this with lower debt. Debt increases risk and reduces options for the company in the future, so you generally want to see some good returns from using it.
Summary
Return on equity is useful for comparing the quality of different businesses. A company that can achieve a high return on equity without debt could be considered a high quality business. All else being equal, a higher ROE is better.
Having said that, while ROE is a useful indicator of business quality, you'll have to look at a whole range of factors to determine the right price to buy a stock. Profit growth rates, versus the expectations reflected in the price of the stock, are a particularly important to consider. So you might want to check this FREE visualization of analyst forecasts for the company.
Of course, you might find a fantastic investment by looking elsewhere. So take a peek at this free list of interesting companies.
Have feedback on this article? Concerned about the content? Get in touch with us directly. Alternatively, email editorial-team (at) simplywallst.com.
This article by Simply Wall St is general in nature. We provide commentary based on historical data and analyst forecasts only using an unbiased methodology and our articles are not intended to be financial advice. It does not constitute a recommendation to buy or sell any stock, and does not take account of your objectives, or your financial situation. We aim to bring you long-term focused analysis driven by fundamental data. Note that our analysis may not factor in the latest price-sensitive company announcements or qualitative material. Simply Wall St has no position in any stocks mentioned.
Join A Paid User Research Session
You’ll receive a US$30 Amazon Gift card for 1 hour of your time while helping us build better investing tools for the individual investors like yourself. Sign up here
