
 Yahoo Finance
 With A -4.9% Earnings Drop, Did SOL S.p.A. (BIT:SOL) Really Underperform?

After looking at SOL S.p.A.'s (BIT:SOL) latest earnings announcement (31 December 2019), I found it useful to revisit the company's performance in the past couple of years and assess this against the most recent figures. As a long-term investor I tend to focus on earnings trend, rather than a single number at one point in time. Also, comparing it against an industry benchmark to understand whether it outperformed, or is simply riding an industry wave, is a crucial aspect. Below is a brief commentary on my key takeaways.
Check out our latest analysis for SOL
Was SOL's weak performance lately a part of a long-term decline?
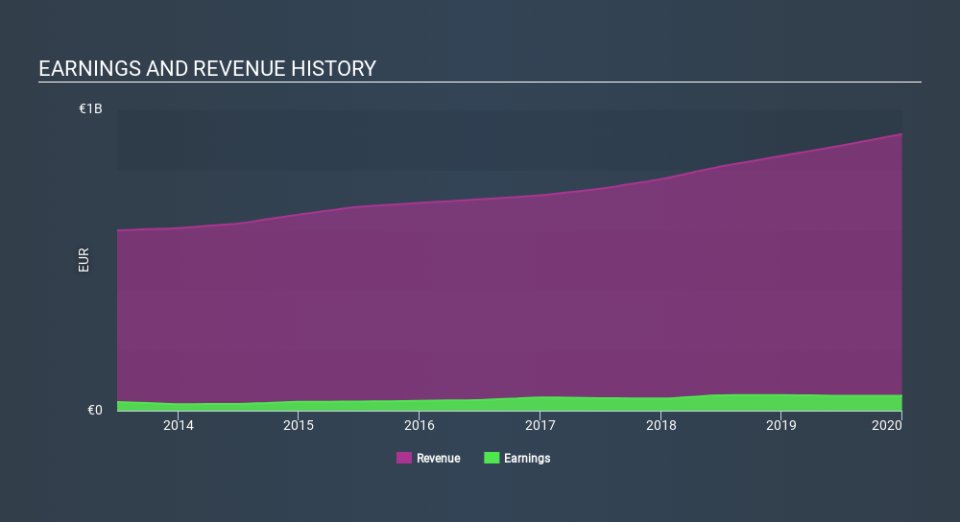
SOL's trailing twelve-month earnings (from 31 December 2019) of €49m has declined by -4.9% compared to the previous year.
Furthermore, this one-year growth rate has been lower than its average earnings growth rate over the past 5 years of 12%, indicating the rate at which SOL is growing has slowed down. Why could this be happening? Well, let's look at what's occurring with margins and if the rest of the industry is feeling the heat.
In terms of returns from investment, SOL has fallen short of achieving a 20% return on equity (ROE), recording 9.0% instead. Furthermore, its return on assets (ROA) of 4.6% is below the IT Chemicals industry of 5.6%, indicating SOL's are utilized less efficiently. However, its return on capital (ROC), which also accounts for SOL’s debt level, has increased over the past 3 years from 8.9% to 9.0%. This correlates with a decrease in debt holding, with debt-to-equity ratio declining from 74% to 73% over the past 5 years.
What does this mean?
While past data is useful, it doesn’t tell the whole story. Companies that are profitable, but have volatile earnings, can have many factors influencing its business. I recommend you continue to research SOL to get a more holistic view of the stock by looking at:
Financial Health: Are SOL’s operations financially sustainable? Balance sheets can be hard to analyze, which is why we’ve done it for you. Check out our financial health checks here.
Valuation: What is SOL worth today? Is the stock undervalued, even when its growth outlook is factored into its intrinsic value? The intrinsic value infographic in our free research report helps visualize whether SOL is currently mispriced by the market.
Other High-Performing Stocks: Are there other stocks that provide better prospects with proven track records? Explore our free list of these great stocks here.
NB: Figures in this article are calculated using data from the trailing twelve months from 31 December 2019. This may not be consistent with full year annual report figures.
Love or hate this article? Concerned about the content? Get in touch with us directly. Alternatively, email editorial-team@simplywallst.com.
This article by Simply Wall St is general in nature. It does not constitute a recommendation to buy or sell any stock, and does not take account of your objectives, or your financial situation. We aim to bring you long-term focused analysis driven by fundamental data. Note that our analysis may not factor in the latest price-sensitive company announcements or qualitative material. Simply Wall St has no position in any stocks mentioned. Thank you for reading.
