
 Yahoo Finance
 These 4 Measures Indicate That Grafton Group (LON:GFTU) Is Using Debt Reasonably Well
Warren Buffett famously said, 'Volatility is far from synonymous with risk.' So it might be obvious that you need to consider debt, when you think about how risky any given stock is, because too much debt can sink a company. Importantly, Grafton Group plc (LON:GFTU) does carry debt. But the real question is whether this debt is making the company risky.
When Is Debt A Problem?
Debt is a tool to help businesses grow, but if a business is incapable of paying off its lenders, then it exists at their mercy. Part and parcel of capitalism is the process of 'creative destruction' where failed businesses are mercilessly liquidated by their bankers. However, a more common (but still painful) scenario is that it has to raise new equity capital at a low price, thus permanently diluting shareholders. Of course, plenty of companies use debt to fund growth, without any negative consequences. When we examine debt levels, we first consider both cash and debt levels, together.
View our latest analysis for Grafton Group
How Much Debt Does Grafton Group Carry?
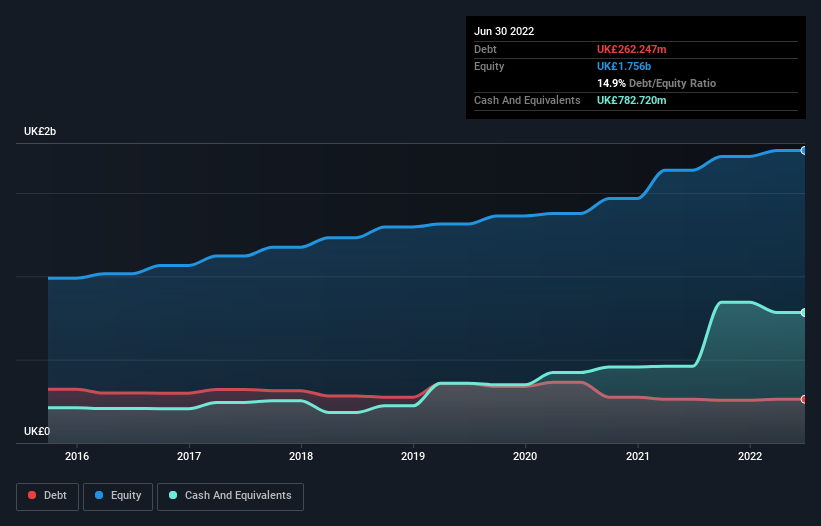
As you can see below, Grafton Group had UK£262.2m of debt, at June 2022, which is about the same as the year before. You can click the chart for greater detail. But it also has UK£782.7m in cash to offset that, meaning it has UK£520.5m net cash.
How Healthy Is Grafton Group's Balance Sheet?
We can see from the most recent balance sheet that Grafton Group had liabilities of UK£685.4m falling due within a year, and liabilities of UK£604.5m due beyond that. Offsetting these obligations, it had cash of UK£782.7m as well as receivables valued at UK£287.4m due within 12 months. So its liabilities total UK£219.8m more than the combination of its cash and short-term receivables.
Given Grafton Group has a market capitalization of UK£1.62b, it's hard to believe these liabilities pose much threat. However, we do think it is worth keeping an eye on its balance sheet strength, as it may change over time. Despite its noteworthy liabilities, Grafton Group boasts net cash, so it's fair to say it does not have a heavy debt load!
But the bad news is that Grafton Group has seen its EBIT plunge 12% in the last twelve months. We think hat kind of performance, if repeated frequently, could well lead to difficulties for the stock. When analysing debt levels, the balance sheet is the obvious place to start. But it is future earnings, more than anything, that will determine Grafton Group's ability to maintain a healthy balance sheet going forward. So if you're focused on the future you can check out this free report showing analyst profit forecasts.
But our final consideration is also important, because a company cannot pay debt with paper profits; it needs cold hard cash. Grafton Group may have net cash on the balance sheet, but it is still interesting to look at how well the business converts its earnings before interest and tax (EBIT) to free cash flow, because that will influence both its need for, and its capacity to manage debt. During the last three years, Grafton Group generated free cash flow amounting to a very robust 95% of its EBIT, more than we'd expect. That positions it well to pay down debt if desirable to do so.
Summing Up
While Grafton Group does have more liabilities than liquid assets, it also has net cash of UK£520.5m. And it impressed us with free cash flow of UK£76m, being 95% of its EBIT. So we are not troubled with Grafton Group's debt use. The balance sheet is clearly the area to focus on when you are analysing debt. However, not all investment risk resides within the balance sheet - far from it. For instance, we've identified 2 warning signs for Grafton Group (1 is potentially serious) you should be aware of.
If, after all that, you're more interested in a fast growing company with a rock-solid balance sheet, then check out our list of net cash growth stocks without delay.
Have feedback on this article? Concerned about the content? Get in touch with us directly. Alternatively, email editorial-team (at) simplywallst.com.
This article by Simply Wall St is general in nature. We provide commentary based on historical data and analyst forecasts only using an unbiased methodology and our articles are not intended to be financial advice. It does not constitute a recommendation to buy or sell any stock, and does not take account of your objectives, or your financial situation. We aim to bring you long-term focused analysis driven by fundamental data. Note that our analysis may not factor in the latest price-sensitive company announcements or qualitative material. Simply Wall St has no position in any stocks mentioned.
Join A Paid User Research Session
You’ll receive a US$30 Amazon Gift card for 1 hour of your time while helping us build better investing tools for the individual investors like yourself. Sign up here
