
 Yahoo Finance
 These 4 Measures Indicate That InterXion Holding (NYSE:INXN) Is Using Debt Extensively

Some say volatility, rather than debt, is the best way to think about risk as an investor, but Warren Buffett famously said that 'Volatility is far from synonymous with risk.' It's only natural to consider a company's balance sheet when you examine how risky it is, since debt is often involved when a business collapses. We note that InterXion Holding N.V. (NYSE:INXN) does have debt on its balance sheet. But is this debt a concern to shareholders?
Why Does Debt Bring Risk?
Debt assists a business until the business has trouble paying it off, either with new capital or with free cash flow. Part and parcel of capitalism is the process of 'creative destruction' where failed businesses are mercilessly liquidated by their bankers. While that is not too common, we often do see indebted companies permanently diluting shareholders because lenders force them to raise capital at a distressed price. Of course, the upside of debt is that it often represents cheap capital, especially when it replaces dilution in a company with the ability to reinvest at high rates of return. When we examine debt levels, we first consider both cash and debt levels, together.
View our latest analysis for InterXion Holding
What Is InterXion Holding's Net Debt?
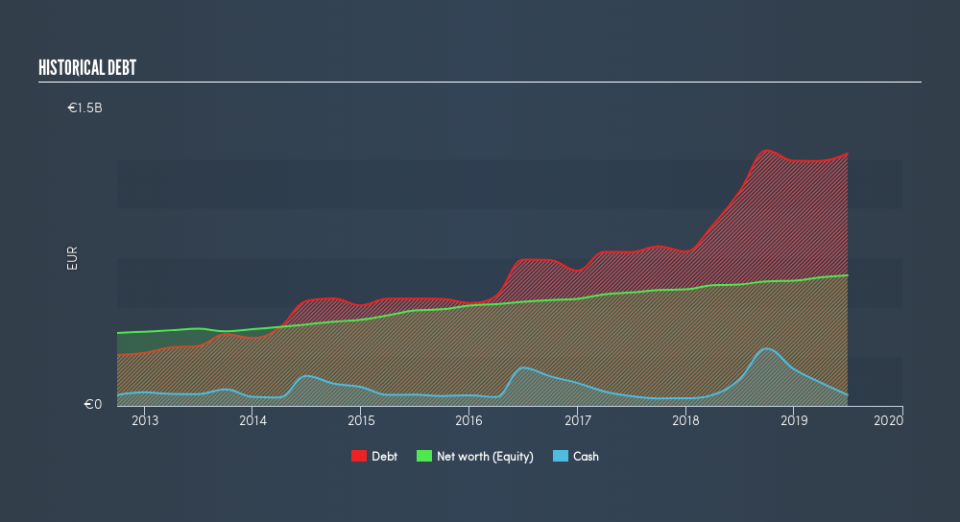
You can click the graphic below for the historical numbers, but it shows that as of June 2019 InterXion Holding had €1.28b of debt, an increase on €1.08b, over one year. However, it also had €55.6m in cash, and so its net debt is €1.22b.
How Healthy Is InterXion Holding's Balance Sheet?
Zooming in on the latest balance sheet data, we can see that InterXion Holding had liabilities of €389.0m due within 12 months and liabilities of €1.69b due beyond that. On the other hand, it had cash of €55.6m and €208.6m worth of receivables due within a year. So it has liabilities totalling €1.82b more than its cash and near-term receivables, combined.
This deficit isn't so bad because InterXion Holding is worth €5.29b, and thus could probably raise enough capital to shore up its balance sheet, if the need arose. However, it is still worthwhile taking a close look at its ability to pay off debt.
In order to size up a company's debt relative to its earnings, we calculate its net debt divided by its earnings before interest, tax, depreciation, and amortization (EBITDA) and its earnings before interest and tax (EBIT) divided by its interest expense (its interest cover). The advantage of this approach is that we take into account both the absolute quantum of debt (with net debt to EBITDA) and the actual interest expenses associated with that debt (with its interest cover ratio).
While we wouldn't worry about InterXion Holding's net debt to EBITDA ratio of 4.6, we think its super-low interest cover of 2.0 times is a sign of high leverage. In large part that's due to the company's significant depreciation and amortisation charges, which arguably mean its EBITDA is a very generous measure of earnings, and its debt may be more of a burden than it first appears. It seems clear that the cost of borrowing money is negatively impacting returns for shareholders, of late. Fortunately, InterXion Holding grew its EBIT by 9.5% in the last year, slowly shrinking its debt relative to earnings. There's no doubt that we learn most about debt from the balance sheet. But ultimately the future profitability of the business will decide if InterXion Holding can strengthen its balance sheet over time. So if you're focused on the future you can check out this free report showing analyst profit forecasts.
Finally, a business needs free cash flow to pay off debt; accounting profits just don't cut it. So we always check how much of that EBIT is translated into free cash flow. During the last three years, InterXion Holding burned a lot of cash. While that may be a result of expenditure for growth, it does make the debt far more risky.
Our View
To be frank both InterXion Holding's interest cover and its track record of converting EBIT to free cash flow make us rather uncomfortable with its debt levels. But at least it's pretty decent at growing its EBIT; that's encouraging. Once we consider all the factors above, together, it seems to us that InterXion Holding's debt is making it a bit risky. That's not necessarily a bad thing, but we'd generally feel more comfortable with less leverage. Over time, share prices tend to follow earnings per share, so if you're interested in InterXion Holding, you may well want to click here to check an interactive graph of its earnings per share history.
When all is said and done, sometimes its easier to focus on companies that don't even need debt. Readers can access a list of growth stocks with zero net debt 100% free, right now.
We aim to bring you long-term focused research analysis driven by fundamental data. Note that our analysis may not factor in the latest price-sensitive company announcements or qualitative material.
If you spot an error that warrants correction, please contact the editor at editorial-team@simplywallst.com. This article by Simply Wall St is general in nature. It does not constitute a recommendation to buy or sell any stock, and does not take account of your objectives, or your financial situation. Simply Wall St has no position in the stocks mentioned. Thank you for reading.
