
 Yahoo Finance
 These 4 Measures Indicate That PUMA (ETR:PUM) Is Using Debt Reasonably Well

David Iben put it well when he said, 'Volatility is not a risk we care about. What we care about is avoiding the permanent loss of capital. It's only natural to consider a company's balance sheet when you examine how risky it is, since debt is often involved when a business collapses. We can see that PUMA SE (ETR:PUM) does use debt in its business. But should shareholders be worried about its use of debt?
What Risk Does Debt Bring?
Debt and other liabilities become risky for a business when it cannot easily fulfill those obligations, either with free cash flow or by raising capital at an attractive price. In the worst case scenario, a company can go bankrupt if it cannot pay its creditors. However, a more usual (but still expensive) situation is where a company must dilute shareholders at a cheap share price simply to get debt under control. Of course, the upside of debt is that it often represents cheap capital, especially when it replaces dilution in a company with the ability to reinvest at high rates of return. When we examine debt levels, we first consider both cash and debt levels, together.
Check out our latest analysis for PUMA
What Is PUMA's Net Debt?
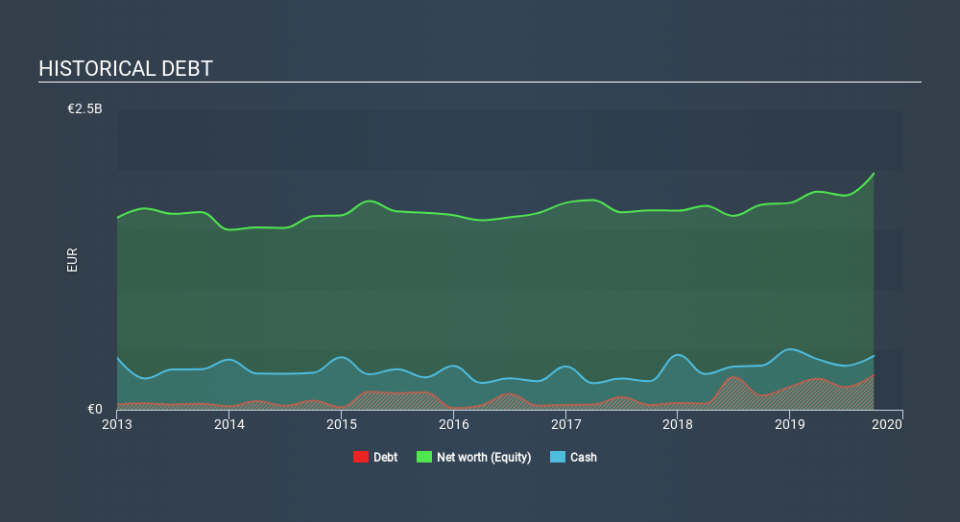
The image below, which you can click on for greater detail, shows that at September 2019 PUMA had debt of €287.9m, up from €117.3m in one year. But it also has €447.4m in cash to offset that, meaning it has €159.5m net cash.
A Look At PUMA's Liabilities
The latest balance sheet data shows that PUMA had liabilities of €1.69b due within a year, and liabilities of €893.9m falling due after that. Offsetting this, it had €447.4m in cash and €794.8m in receivables that were due within 12 months. So its liabilities outweigh the sum of its cash and (near-term) receivables by €1.35b.
Given PUMA has a humongous market capitalization of €10.0b, it's hard to believe these liabilities pose much threat. But there are sufficient liabilities that we would certainly recommend shareholders continue to monitor the balance sheet, going forward. Despite its noteworthy liabilities, PUMA boasts net cash, so it's fair to say it does not have a heavy debt load!
Also positive, PUMA grew its EBIT by 28% in the last year, and that should make it easier to pay down debt, going forward. There's no doubt that we learn most about debt from the balance sheet. But it is future earnings, more than anything, that will determine PUMA's ability to maintain a healthy balance sheet going forward. So if you're focused on the future you can check out this free report showing analyst profit forecasts.
Finally, a company can only pay off debt with cold hard cash, not accounting profits. While PUMA has net cash on its balance sheet, it's still worth taking a look at its ability to convert earnings before interest and tax (EBIT) to free cash flow, to help us understand how quickly it is building (or eroding) that cash balance. In the last three years, PUMA's free cash flow amounted to 36% of its EBIT, less than we'd expect. That's not great, when it comes to paying down debt.
Summing up
Although PUMA's balance sheet isn't particularly strong, due to the total liabilities, it is clearly positive to see that it has net cash of €159.5m. And it impressed us with its EBIT growth of 28% over the last year. So we don't think PUMA's use of debt is risky. Above most other metrics, we think its important to track how fast earnings per share is growing, if at all. If you've also come to that realization, you're in luck, because today you can view this interactive graph of PUMA's earnings per share history for free.
Of course, if you're the type of investor who prefers buying stocks without the burden of debt, then don't hesitate to discover our exclusive list of net cash growth stocks, today.
If you spot an error that warrants correction, please contact the editor at editorial-team@simplywallst.com. This article by Simply Wall St is general in nature. It does not constitute a recommendation to buy or sell any stock, and does not take account of your objectives, or your financial situation. Simply Wall St has no position in the stocks mentioned.
We aim to bring you long-term focused research analysis driven by fundamental data. Note that our analysis may not factor in the latest price-sensitive company announcements or qualitative material. Thank you for reading.
