
 Yahoo Finance
 These 4 Measures Indicate That Terveystalo Oyj (HEL:TTALO) Is Using Debt Reasonably Well

Howard Marks put it nicely when he said that, rather than worrying about share price volatility, 'The possibility of permanent loss is the risk I worry about... and every practical investor I know worries about. When we think about how risky a company is, we always like to look at its use of debt, since debt overload can lead to ruin. We note that Terveystalo Oyj (HEL:TTALO) does have debt on its balance sheet. But should shareholders be worried about its use of debt?
When Is Debt Dangerous?
Generally speaking, debt only becomes a real problem when a company can't easily pay it off, either by raising capital or with its own cash flow. In the worst case scenario, a company can go bankrupt if it cannot pay its creditors. However, a more common (but still painful) scenario is that it has to raise new equity capital at a low price, thus permanently diluting shareholders. By replacing dilution, though, debt can be an extremely good tool for businesses that need capital to invest in growth at high rates of return. The first thing to do when considering how much debt a business uses is to look at its cash and debt together.
Check out our latest analysis for Terveystalo Oyj
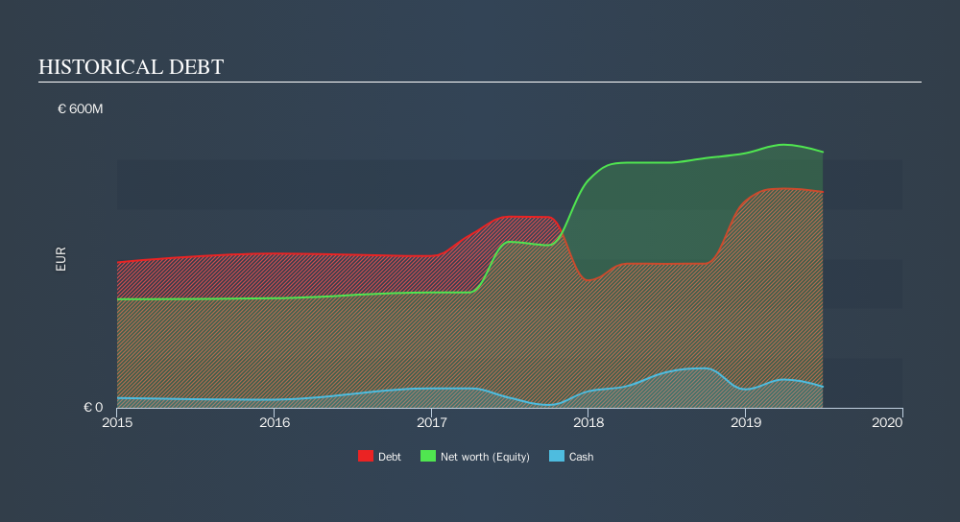
How Much Debt Does Terveystalo Oyj Carry?
The image below, which you can click on for greater detail, shows that at June 2019 Terveystalo Oyj had debt of €434.0m, up from €289.6m in one year. However, it does have €42.6m in cash offsetting this, leading to net debt of about €391.4m.
How Healthy Is Terveystalo Oyj's Balance Sheet?
According to the last reported balance sheet, Terveystalo Oyj had liabilities of €266.4m due within 12 months, and liabilities of €580.5m due beyond 12 months. On the other hand, it had cash of €42.6m and €100.6m worth of receivables due within a year. So its liabilities outweigh the sum of its cash and (near-term) receivables by €703.7m.
Terveystalo Oyj has a market capitalization of €1.21b, so it could very likely raise cash to ameliorate its balance sheet, if the need arose. But we definitely want to keep our eyes open to indications that its debt is bringing too much risk.
We use two main ratios to inform us about debt levels relative to earnings. The first is net debt divided by earnings before interest, tax, depreciation, and amortization (EBITDA), while the second is how many times its earnings before interest and tax (EBIT) covers its interest expense (or its interest cover, for short). The advantage of this approach is that we take into account both the absolute quantum of debt (with net debt to EBITDA) and the actual interest expenses associated with that debt (with its interest cover ratio).
With net debt to EBITDA of 3.3 Terveystalo Oyj has a fairly noticeable amount of debt. On the plus side, its EBIT was 7.7 times its interest expense, and its net debt to EBITDA, was quite high, at 3.3. Importantly, Terveystalo Oyj grew its EBIT by 60% over the last twelve months, and that growth will make it easier to handle its debt. When analysing debt levels, the balance sheet is the obvious place to start. But it is future earnings, more than anything, that will determine Terveystalo Oyj's ability to maintain a healthy balance sheet going forward. So if you want to see what the professionals think, you might find this free report on analyst profit forecasts to be interesting.
But our final consideration is also important, because a company cannot pay debt with paper profits; it needs cold hard cash. So we always check how much of that EBIT is translated into free cash flow. Happily for any shareholders, Terveystalo Oyj actually produced more free cash flow than EBIT over the last three years. That sort of strong cash generation warms our hearts like a puppy in a bumblebee suit.
Our View
The good news is that Terveystalo Oyj's demonstrated ability to convert EBIT to free cash flow delights us like a fluffy puppy does a toddler. But truth be told we feel its net debt to EBITDA does undermine this impression a bit. It's also worth noting that Terveystalo Oyj is in the Healthcare industry, which is often considered to be quite defensive. When we consider the range of factors above, it looks like Terveystalo Oyj is pretty sensible with its use of debt. That means they are taking on a bit more risk, in the hope of boosting shareholder returns. Above most other metrics, we think its important to track how fast earnings per share is growing, if at all. If you've also come to that realization, you're in luck, because today you can view this interactive graph of Terveystalo Oyj's earnings per share history for free.
At the end of the day, it's often better to focus on companies that are free from net debt. You can access our special list of such companies (all with a track record of profit growth). It's free.
We aim to bring you long-term focused research analysis driven by fundamental data. Note that our analysis may not factor in the latest price-sensitive company announcements or qualitative material.
If you spot an error that warrants correction, please contact the editor at editorial-team@simplywallst.com. This article by Simply Wall St is general in nature. It does not constitute a recommendation to buy or sell any stock, and does not take account of your objectives, or your financial situation. Simply Wall St has no position in the stocks mentioned. Thank you for reading.
