
 Yahoo Finance
 With A -46.04% Earnings Drop, Did SES SA (BDL:SESGL) Really Underperform?

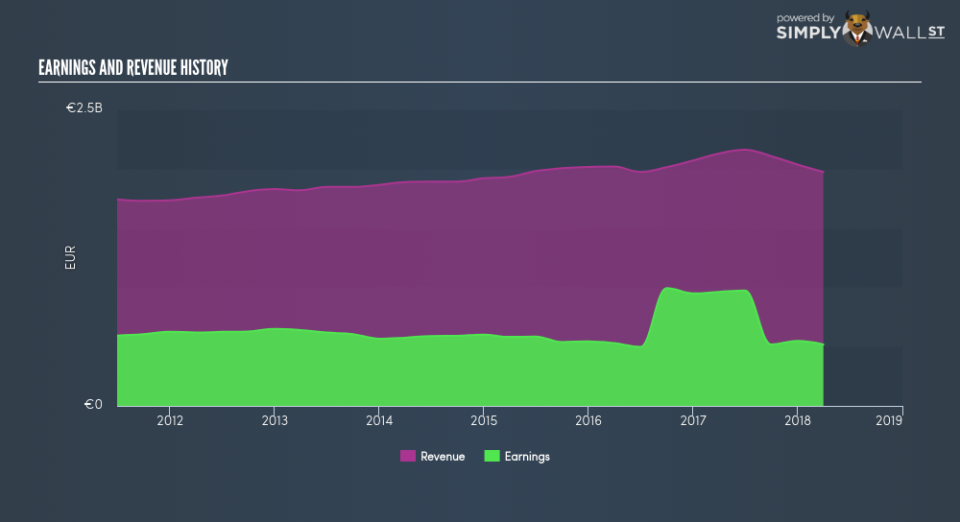
When SES SA (BDL:SESGL) announced its most recent earnings (31 March 2018), I did two things: looked at its past earnings track record, then look at what is happening in the industry. Understanding how SES performed requires a benchmark rather than trying to assess a standalone number at one point in time. Below is a quick commentary on how I see SESGL has performed. Check out our latest analysis for SES
How Did SESGL’s Recent Performance Stack Up Against Its Past?
SESGL’s trailing twelve-month earnings (from 31 March 2018) of €518.60m has declined by -46.04% compared to the previous year. Furthermore, this one-year growth rate has been lower than its average earnings growth rate over the past 5 years of 2.58%, indicating the rate at which SESGL is growing has slowed down. Why is this? Well, let’s take a look at what’s going on with margins and whether the entire industry is experiencing the hit as well.
Revenue growth over the last few years, has been positive, however, earnings growth has not been able to catch up, meaning SES has been ramping up its expenses by a lot more. This harms margins and earnings, and is not a sustainable practice. Looking at growth from a sector-level, the LU media industry has been growing its average earnings by double-digit 21.69% over the previous twelve months, and a more subdued 8.69% over the previous five years. This means any uplift the industry is profiting from, SES has not been able to leverage it as much as its average peer.
In terms of returns from investment, SES has not invested its equity funds well, leading to a 9.52% return on equity (ROE), below the sensible minimum of 20%. Furthermore, its return on assets (ROA) of 5.42% is below the LU Media industry of 6.15%, indicating SES’s are utilized less efficiently. And finally, its return on capital (ROC), which also accounts for SES’s debt level, has declined over the past 3 years from 7.59% to 4.15%.
What does this mean?
While past data is useful, it doesn’t tell the whole story. Usually companies that experience a prolonged period of reduction in earnings are undergoing some sort of reinvestment phase in order to keep up with the latest industry disruption and growth. You should continue to research SES to get a better picture of the stock by looking at:
Future Outlook: What are well-informed industry analysts predicting for SESGL’s future growth? Take a look at our free research report of analyst consensus for SESGL’s outlook.
Financial Health: Is SESGL’s operations financially sustainable? Balance sheets can be hard to analyze, which is why we’ve done it for you. Check out our financial health checks here.
Other High-Performing Stocks: Are there other stocks that provide better prospects with proven track records? Explore our free list of these great stocks here.
NB: Figures in this article are calculated using data from the trailing twelve months from 31 March 2018. This may not be consistent with full year annual report figures.
To help readers see pass the short term volatility of the financial market, we aim to bring you a long-term focused research analysis purely driven by fundamental data. Note that our analysis does not factor in the latest price sensitive company announcements.
The author is an independent contributor and at the time of publication had no position in the stocks mentioned.
