
 Yahoo Finance
 Are The 600 Group PLC’s Returns On Capital Worth Investigating?

Today we are going to look at The 600 Group PLC (LON:SIXH) to see whether it might be an attractive investment prospect. To be precise, we'll consider its Return On Capital Employed (ROCE), as that will inform our view of the quality of the business.
First up, we'll look at what ROCE is and how we calculate it. Then we'll compare its ROCE to similar companies. Then we'll determine how its current liabilities are affecting its ROCE.
What is Return On Capital Employed (ROCE)?
ROCE is a metric for evaluating how much pre-tax income (in percentage terms) a company earns on the capital invested in its business. In general, businesses with a higher ROCE are usually better quality. Ultimately, it is a useful but imperfect metric. Renowned investment researcher Michael Mauboussin has suggested that a high ROCE can indicate that 'one dollar invested in the company generates value of more than one dollar'.
So, How Do We Calculate ROCE?
The formula for calculating the return on capital employed is:
Return on Capital Employed = Earnings Before Interest and Tax (EBIT) ÷ (Total Assets - Current Liabilities)
Or for 600 Group:
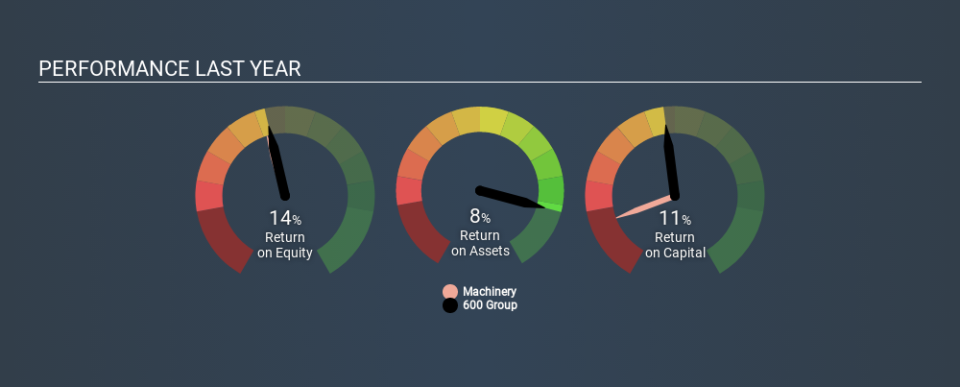
0.11 = US$5.9m ÷ (US$72m - US$19m) (Based on the trailing twelve months to September 2019.)
So, 600 Group has an ROCE of 11%.
See our latest analysis for 600 Group
Does 600 Group Have A Good ROCE?
ROCE is commonly used for comparing the performance of similar businesses. Using our data, 600 Group's ROCE appears to be around the 12% average of the Machinery industry. Independently of how 600 Group compares to its industry, its ROCE in absolute terms appears decent, and the company may be worthy of closer investigation.
600 Group delivered an ROCE of 11%, which is better than 3 years ago, as was making losses back then. That suggests the business has returned to profitability. You can see in the image below how 600 Group's ROCE compares to its industry. Click to see more on past growth.
When considering this metric, keep in mind that it is backwards looking, and not necessarily predictive. ROCE can be deceptive for cyclical businesses, as returns can look incredible in boom times, and terribly low in downturns. This is because ROCE only looks at one year, instead of considering returns across a whole cycle. Since the future is so important for investors, you should check out our free report on analyst forecasts for 600 Group.
Do 600 Group's Current Liabilities Skew Its ROCE?
Current liabilities include invoices, such as supplier payments, short-term debt, or a tax bill, that need to be paid within 12 months. The ROCE equation subtracts current liabilities from capital employed, so a company with a lot of current liabilities appears to have less capital employed, and a higher ROCE than otherwise. To check the impact of this, we calculate if a company has high current liabilities relative to its total assets.
600 Group has total assets of US$72m and current liabilities of US$19m. Therefore its current liabilities are equivalent to approximately 26% of its total assets. Low current liabilities are not boosting the ROCE too much.
What We Can Learn From 600 Group's ROCE
Overall, 600 Group has a decent ROCE and could be worthy of further research. There might be better investments than 600 Group out there, but you will have to work hard to find them . These promising businesses with rapidly growing earnings might be right up your alley.
If you are like me, then you will not want to miss this free list of growing companies that insiders are buying.
If you spot an error that warrants correction, please contact the editor at editorial-team@simplywallst.com. This article by Simply Wall St is general in nature. It does not constitute a recommendation to buy or sell any stock, and does not take account of your objectives, or your financial situation. Simply Wall St has no position in the stocks mentioned.
We aim to bring you long-term focused research analysis driven by fundamental data. Note that our analysis may not factor in the latest price-sensitive company announcements or qualitative material. Thank you for reading.
