
 Yahoo Finance
 The 9.6% return this week takes Qantas Airways' (ASX:QAN) shareholders three-year gains to 14%
By buying an index fund, investors can approximate the average market return. But if you pick the right individual stocks, you could make more than that. For example, the Qantas Airways Limited (ASX:QAN) share price is up 14% in the last three years, clearly besting the market return of around 8.6% (not including dividends).
Since the stock has added AU$851m to its market cap in the past week alone, let's see if underlying performance has been driving long-term returns.
Check out our latest analysis for Qantas Airways
In his essay The Superinvestors of Graham-and-Doddsville Warren Buffett described how share prices do not always rationally reflect the value of a business. One imperfect but simple way to consider how the market perception of a company has shifted is to compare the change in the earnings per share (EPS) with the share price movement.
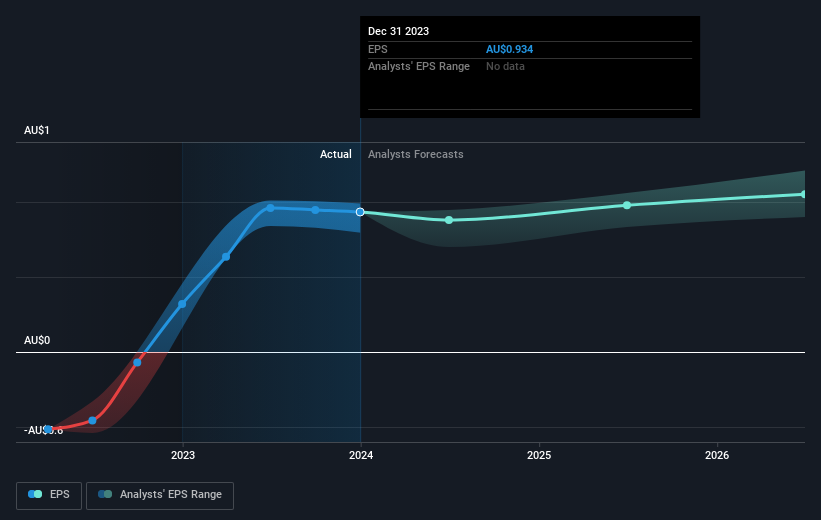
Qantas Airways became profitable within the last three years. That would generally be considered a positive, so we'd expect the share price to be up.
You can see below how EPS has changed over time (discover the exact values by clicking on the image).
We consider it positive that insiders have made significant purchases in the last year. Even so, future earnings will be far more important to whether current shareholders make money. This free interactive report on Qantas Airways' earnings, revenue and cash flow is a great place to start, if you want to investigate the stock further.
A Different Perspective
Qantas Airways shareholders are down 8.8% for the year, but the market itself is up 12%. However, keep in mind that even the best stocks will sometimes underperform the market over a twelve month period. Longer term investors wouldn't be so upset, since they would have made 1.3%, each year, over five years. If the fundamental data continues to indicate long term sustainable growth, the current sell-off could be an opportunity worth considering. I find it very interesting to look at share price over the long term as a proxy for business performance. But to truly gain insight, we need to consider other information, too. For instance, we've identified 2 warning signs for Qantas Airways (1 makes us a bit uncomfortable) that you should be aware of.
There are plenty of other companies that have insiders buying up shares. You probably do not want to miss this free list of growing companies that insiders are buying.
Please note, the market returns quoted in this article reflect the market weighted average returns of stocks that currently trade on Australian exchanges.
Have feedback on this article? Concerned about the content? Get in touch with us directly. Alternatively, email editorial-team (at) simplywallst.com.
This article by Simply Wall St is general in nature. We provide commentary based on historical data and analyst forecasts only using an unbiased methodology and our articles are not intended to be financial advice. It does not constitute a recommendation to buy or sell any stock, and does not take account of your objectives, or your financial situation. We aim to bring you long-term focused analysis driven by fundamental data. Note that our analysis may not factor in the latest price-sensitive company announcements or qualitative material. Simply Wall St has no position in any stocks mentioned.
