
 Yahoo Finance
 With A -90.70% Earnings Drop, Is Swiss Re Ltd’s (VTX:SREN) A Concern?

For investors, increase in profitability and industry-beating performance can be essential considerations in an investment. Below, I will examine Swiss Re Ltd’s (SWX:SREN) track record on a high level, to give you some insight into how the company has been performing against its long term trend and its industry peers. Check out our latest analysis for Swiss Re
Did SREN perform worse than its track record and industry?
For the purpose of this commentary, I like to use the ‘latest twelve-month’ data, which annualizes the latest 6-month earnings release, or some times, the latest annual report is already the most recent financial data. This allows me to examine various companies in a uniform manner using the latest information. For Swiss Re, its most recent bottom-line (trailing twelve month) is US$331.00M, which, in comparison to the previous year’s figure, has taken a dive by a significant -90.70%. Since these values are fairly myopic, I have determined an annualized five-year value for SREN’s net income, which stands at US$3.48B This doesn’t seem to paint a better picture, since earnings seem to have gradually been declining over the longer term.
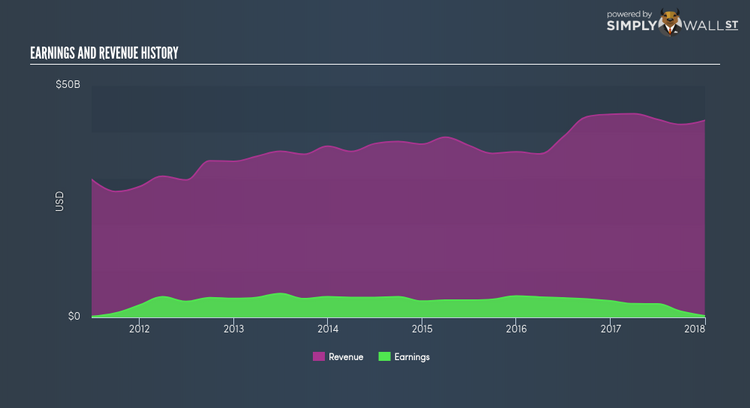
Why could this be happening? Let’s examine what’s occurring with margins and whether the entire industry is experiencing the hit as well. Revenue growth in the last few years, has been positive, nevertheless earnings growth has been deteriorating. This implies that Swiss Re has been increasing expenses, which is harming margins and earnings, and is not a sustainable practice. Scanning growth from a sector-level, the CH insurance industry has been enduring some headwinds in the previous year, leading to an average earnings drop of -2.31%. This is a major change, given that the industry has been delivering a positive rate of 3.62%, on average, over the previous five years. This suggests that any near-term headwind the industry is facing, it’s hitting Swiss Re harder than its peers.
What does this mean?
Swiss Re’s track record can be a valuable insight into its earnings performance, but it certainly doesn’t tell the whole story. In some cases, companies that experience a drawn out period of reduction in earnings are undergoing some sort of reinvestment phase Although, if the entire industry is struggling to grow over time, it may be a indicator of a structural change, which makes Swiss Re and its peers a higher risk investment. I recommend you continue to research Swiss Re to get a more holistic view of the stock by looking at:
Future Outlook: What are well-informed industry analysts predicting for SREN’s future growth? Take a look at our free research report of analyst consensus for SREN’s outlook.
Financial Health: Is SREN’s operations financially sustainable? Balance sheets can be hard to analyze, which is why we’ve done it for you. Check out our financial health checks here.
Other High-Performing Stocks: Are there other stocks that provide better prospects with proven track records? Explore our free list of these great stocks here.
NB: Figures in this article are calculated using data from the trailing twelve months from 31 December 2017. This may not be consistent with full year annual report figures.
To help readers see pass the short term volatility of the financial market, we aim to bring you a long-term focused research analysis purely driven by fundamental data. Note that our analysis does not factor in the latest price sensitive company announcements.
The author is an independent contributor and at the time of publication had no position in the stocks mentioned.
