
 Yahoo Finance
 Has AB Dynamics Plc (LON:ABDP) Improved Earnings In Recent Times?

Examining AB Dynamics Plc’s (LON:ABDP) past track record of performance is a useful exercise for investors. It allows us to reflect on whether the company has met or exceed expectations, which is a powerful signal for future performance. Below, I will assess ABDP’s latest performance announced on 28 February 2018 and weight these figures against its longer term trend and industry movements.
See our latest analysis for AB Dynamics
Did ABDP beat its long-term earnings growth trend and its industry?
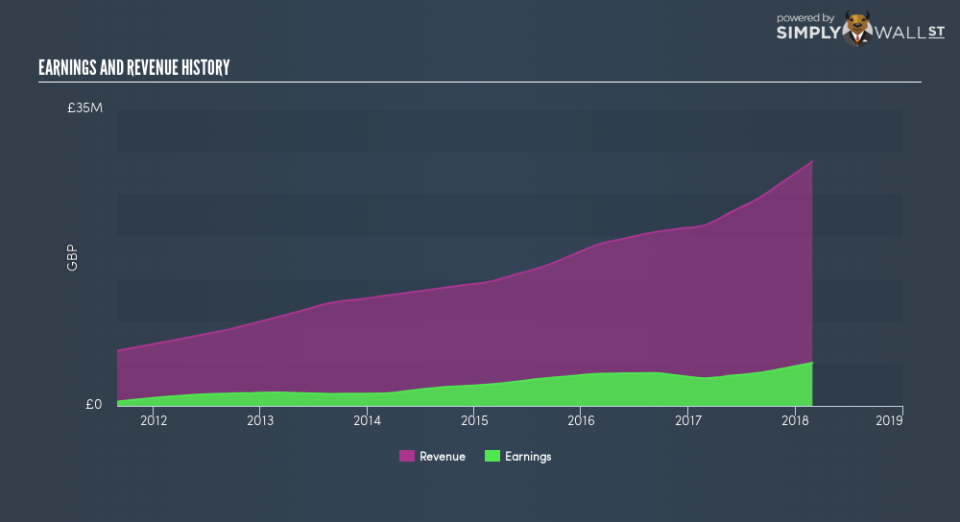
ABDP’s trailing twelve-month earnings (from 28 February 2018) of UK£5.1m has jumped 55.0% compared to the previous year. Furthermore, this one-year growth rate has exceeded its 5-year annual growth average of 23.4%, indicating the rate at which ABDP is growing has accelerated. How has it been able to do this? Let’s see whether it is merely attributable to industry tailwinds, or if AB Dynamics has seen some company-specific growth.
In the past few years, AB Dynamics expanded its bottom line faster than revenue by effectively controlling its costs. This has caused a margin expansion and profitability over time. Scanning growth from a sector-level, the UK auto components industry has been growing its average earnings by double-digit 13.7% over the prior twelve months, and a more muted 7.4% over the last five years. Since the Auto Components sector in GB is relatively small, I’ve included similar companies in the wider region in order to get a better idea of the growth, which is a median of profitable companies of companies such as TI Fluid Systems, GKN and . This means any uplift the industry is enjoying, AB Dynamics is able to amplify this to its advantage.
In terms of returns from investment, AB Dynamics has fallen short of achieving a 20% return on equity (ROE), recording 16.0% instead. However, its return on assets (ROA) of 12.0% exceeds the GB Auto Components industry of 6.1%, indicating AB Dynamics has used its assets more efficiently. Though, its return on capital (ROC), which also accounts for AB Dynamics’s debt level, has declined over the past 3 years from 26.2% to 18.2%.
What does this mean?
Though AB Dynamics’s past data is helpful, it is only one aspect of my investment thesis. While AB Dynamics has a good historical track record with positive growth and profitability, there’s no certainty that this will extrapolate into the future. I suggest you continue to research AB Dynamics to get a better picture of the stock by looking at:
Future Outlook: What are well-informed industry analysts predicting for ABDP’s future growth? Take a look at our free research report of analyst consensus for ABDP’s outlook.
Financial Health: Are ABDP’s operations financially sustainable? Balance sheets can be hard to analyze, which is why we’ve done it for you. Check out our financial health checks here.
Other High-Performing Stocks: Are there other stocks that provide better prospects with proven track records? Explore our free list of these great stocks here.
NB: Figures in this article are calculated using data from the trailing twelve months from 28 February 2018. This may not be consistent with full year annual report figures.
To help readers see past the short term volatility of the financial market, we aim to bring you a long-term focused research analysis purely driven by fundamental data. Note that our analysis does not factor in the latest price-sensitive company announcements.
The author is an independent contributor and at the time of publication had no position in the stocks mentioned. For errors that warrant correction please contact the editor at editorial-team@simplywallst.com.
