
 Yahoo Finance
 Has Abertis Infraestructuras SA. (BME:ABE) Improved Earnings Growth In Recent Times?

Investors with a long-term horizong may find it valuable to assess Abertis Infraestructuras SA.’s (BME:ABE) earnings trend over time and against its industry benchmark as opposed to simply looking at a sincle earnings announcement at one point in time. Below is my commentary, albiet very simple and high-level, on how Abertis Infraestructuras is currently performing. Check out our latest analysis for Abertis Infraestructuras
How Well Did ABE Perform?
To account for any quarterly or half-yearly updates, I use the ‘latest twelve-month’ data, which either annualizes the most recent 6-month earnings update, or in some cases, the most recent annual report is already the latest available financial data. This enables me to analyze different companies on a more comparable basis, using the most relevant data points. For Abertis Infraestructuras, its most recent bottom-line (trailing twelve month) is €887.10M, which compared to last year’s level, has moved up by a non-trivial 64.52%. Since these figures may be fairly short-term thinking, I’ve calculated an annualized five-year figure for ABE’s net income, which stands at €525.20M This means generally, Abertis Infraestructuras has been able to increasingly raise its earnings over the last few years as well.
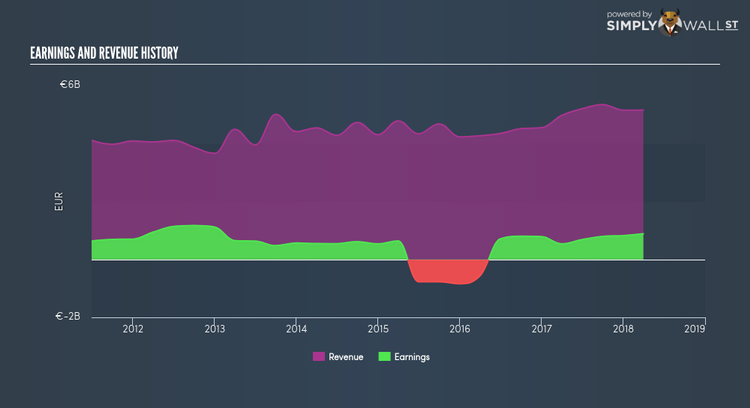
What’s the driver of this growth? Well, let’s take a look at if it is merely owing to industry tailwinds, or if Abertis Infraestructuras has seen some company-specific growth. In the past couple of years, Abertis Infraestructuras top-line expansion has overtaken earnings and the growth rate of expenses. Though this has led to a margin contraction, it has moderated Abertis Infraestructuras’s earnings contraction. Scanning growth from a sector-level, the ES infrastructure industry has been growing its average earnings by double-digit 11.25% in the past twelve months, and a less exciting 8.26% over the previous five years. This suggests that any uplift the industry is enjoying, Abertis Infraestructuras is capable of leveraging this to its advantage.
What does this mean?
Though Abertis Infraestructuras’s past data is helpful, it is only one aspect of my investment thesis. While Abertis Infraestructuras has a good historical track record with positive growth and profitability, there’s no certainty that this will extrapolate into the future. I suggest you continue to research Abertis Infraestructuras to get a better picture of the stock by looking at:
Future Outlook: What are well-informed industry analysts predicting for ABE’s future growth? Take a look at our free research report of analyst consensus for ABE’s outlook.
Financial Health: Is ABE’s operations financially sustainable? Balance sheets can be hard to analyze, which is why we’ve done it for you. Check out our financial health checks here.
Other High-Performing Stocks: Are there other stocks that provide better prospects with proven track records? Explore our free list of these great stocks here.
NB: Figures in this article are calculated using data from the trailing twelve months from 31 March 2018. This may not be consistent with full year annual report figures.
To help readers see pass the short term volatility of the financial market, we aim to bring you a long-term focused research analysis purely driven by fundamental data. Note that our analysis does not factor in the latest price sensitive company announcements.
The author is an independent contributor and at the time of publication had no position in the stocks mentioned.
