
 Yahoo Finance
 Adecco Group (VTX:ADEN) Might Be Having Difficulty Using Its Capital Effectively
What are the early trends we should look for to identify a stock that could multiply in value over the long term? Amongst other things, we'll want to see two things; firstly, a growing return on capital employed (ROCE) and secondly, an expansion in the company's amount of capital employed. This shows us that it's a compounding machine, able to continually reinvest its earnings back into the business and generate higher returns. Although, when we looked at Adecco Group (VTX:ADEN), it didn't seem to tick all of these boxes.
What Is Return On Capital Employed (ROCE)?
For those that aren't sure what ROCE is, it measures the amount of pre-tax profits a company can generate from the capital employed in its business. Analysts use this formula to calculate it for Adecco Group:
Return on Capital Employed = Earnings Before Interest and Tax (EBIT) ÷ (Total Assets - Current Liabilities)
0.11 = €802m ÷ (€13b - €5.4b) (Based on the trailing twelve months to June 2022).
Therefore, Adecco Group has an ROCE of 11%. That's a relatively normal return on capital, and it's around the 13% generated by the Professional Services industry.
See our latest analysis for Adecco Group
Above you can see how the current ROCE for Adecco Group compares to its prior returns on capital, but there's only so much you can tell from the past. If you're interested, you can view the analysts predictions in our free report on analyst forecasts for the company.
What The Trend Of ROCE Can Tell Us
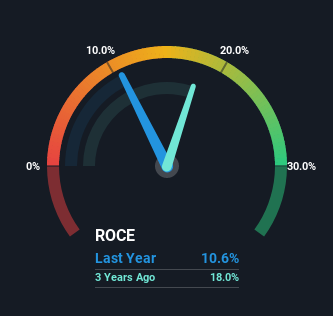
In terms of Adecco Group's historical ROCE movements, the trend isn't fantastic. Around five years ago the returns on capital were 22%, but since then they've fallen to 11%. Meanwhile, the business is utilizing more capital but this hasn't moved the needle much in terms of sales in the past 12 months, so this could reflect longer term investments. It may take some time before the company starts to see any change in earnings from these investments.
On a separate but related note, it's important to know that Adecco Group has a current liabilities to total assets ratio of 42%, which we'd consider pretty high. This can bring about some risks because the company is basically operating with a rather large reliance on its suppliers or other sorts of short-term creditors. Ideally we'd like to see this reduce as that would mean fewer obligations bearing risks.
What We Can Learn From Adecco Group's ROCE
In summary, Adecco Group is reinvesting funds back into the business for growth but unfortunately it looks like sales haven't increased much just yet. And investors appear hesitant that the trends will pick up because the stock has fallen 49% in the last five years. Therefore based on the analysis done in this article, we don't think Adecco Group has the makings of a multi-bagger.
One more thing: We've identified 3 warning signs with Adecco Group (at least 1 which is a bit unpleasant) , and understanding them would certainly be useful.
While Adecco Group isn't earning the highest return, check out this free list of companies that are earning high returns on equity with solid balance sheets.
Have feedback on this article? Concerned about the content? Get in touch with us directly. Alternatively, email editorial-team (at) simplywallst.com.
This article by Simply Wall St is general in nature. We provide commentary based on historical data and analyst forecasts only using an unbiased methodology and our articles are not intended to be financial advice. It does not constitute a recommendation to buy or sell any stock, and does not take account of your objectives, or your financial situation. We aim to bring you long-term focused analysis driven by fundamental data. Note that our analysis may not factor in the latest price-sensitive company announcements or qualitative material. Simply Wall St has no position in any stocks mentioned.
Join A Paid User Research Session
You’ll receive a US$30 Amazon Gift card for 1 hour of your time while helping us build better investing tools for the individual investors like yourself. Sign up here
