
 Yahoo Finance
 Is ADF Group Inc.'s (TSE:DRX) CEO Paid Enough Relative To Peers?

The CEO of ADF Group Inc. (TSE:DRX) is Jean Paschini. First, this article will compare CEO compensation with compensation at similar sized companies. Then we'll look at a snap shot of the business growth. And finally - as a second measure of performance - we will look at the returns shareholders have received over the last few years. This method should give us information to assess how appropriately the company pays the CEO.
View our latest analysis for ADF Group
How Does Jean Paschini's Compensation Compare With Similar Sized Companies?
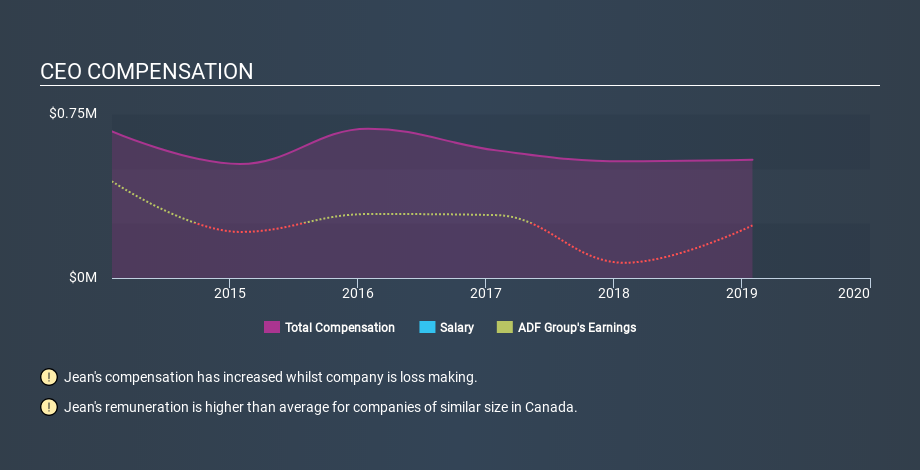
According to our data, ADF Group Inc. has a market capitalization of CA$29m, and paid its CEO total annual compensation worth CA$541k over the year to January 2019. We examined a group of similar sized companies, with market capitalizations of below CA$279m. The median CEO total compensation in that group is CA$219k.
Pay mix tells us a lot about how a company functions versus the wider industry, and it's no different in the case of ADF Group. Talking in terms of the sector, salary represented approximately 91% of total compensation out of all the companies we analysed, while other remuneration made up 9.1% of the pie. Talking in terms of the company, ADF Group prefers to reward its CEO through non-salary benefits, opting not to give Jean Paschini a salary.
Thus we can conclude that Jean Paschini receives more in total compensation than the median of a group of companies in the same market, and of similar size to ADF Group Inc.. However, this doesn't necessarily mean the pay is too high. We can get a better idea of how generous the pay is by looking at the performance of the underlying business. You can see, below, how CEO compensation at ADF Group has changed over time.
Is ADF Group Inc. Growing?
Over the last three years ADF Group Inc. has shrunk its earnings per share by an average of 13% per year (measured with a line of best fit). In the last year, its revenue is up 33%.
Investors should note that, over three years, earnings per share are down. On the other hand, the strong revenue growth suggests the business is growing. These two metric are moving in different directions, so while it's hard to be confident judging performance, we think the stock is worth watching. Although we don't have analyst forecasts shareholders might want to examine this detailed historical graph of earnings, revenue and cash flow.
Has ADF Group Inc. Been A Good Investment?
Since shareholders would have lost about 68% over three years, some ADF Group Inc. shareholders would surely be feeling negative emotions. It therefore might be upsetting for shareholders if the CEO were paid generously.
In Summary...
We compared total CEO remuneration at ADF Group Inc. with the amount paid at companies with a similar market capitalization. We found that it pays well over the median amount paid in the benchmark group.
While we have not been overly impressed by the business performance, the shareholder returns, over three years, have been disappointing. Considering this, we have the opinion that the CEO pay is more on the generous side, than the modest side. CEO compensation is an important area to keep your eyes on, but we've also identified 4 warning signs for ADF Group (1 is a bit unpleasant!) that you should be aware of before investing here.
Arguably, business quality is much more important than CEO compensation levels. So check out this free list of interesting companies, that have HIGH return on equity and low debt.
Love or hate this article? Concerned about the content? Get in touch with us directly. Alternatively, email editorial-team@simplywallst.com.
This article by Simply Wall St is general in nature. It does not constitute a recommendation to buy or sell any stock, and does not take account of your objectives, or your financial situation. We aim to bring you long-term focused analysis driven by fundamental data. Note that our analysis may not factor in the latest price-sensitive company announcements or qualitative material. Simply Wall St has no position in any stocks mentioned. Thank you for reading.
