
 Yahoo Finance
 Admiral Group (LON:ADM) Will Pay A Dividend Of £0.52
The board of Admiral Group plc (LON:ADM) has announced that it will pay a dividend on the 7th of June, with investors receiving £0.52 per share. The dividend yield is 3.8% based on this payment, which is a little bit low compared to the other companies in the industry.
View our latest analysis for Admiral Group
Admiral Group's Earnings Easily Cover The Distributions
It would be nice for the yield to be higher, but we should also check if higher levels of dividend payment would be sustainable. Prior to this announcement, Admiral Group's dividend was only 66% of earnings, however it was paying out 152% of free cash flows. This signals that the company is more focused on returning cash flow to shareholders, but it could mean that the dividend is exposed to cuts in the future.
Over the next year, EPS is forecast to expand by 67.5%. Assuming the dividend continues along recent trends, we think the payout ratio could be 59% by next year, which is in a pretty sustainable range.
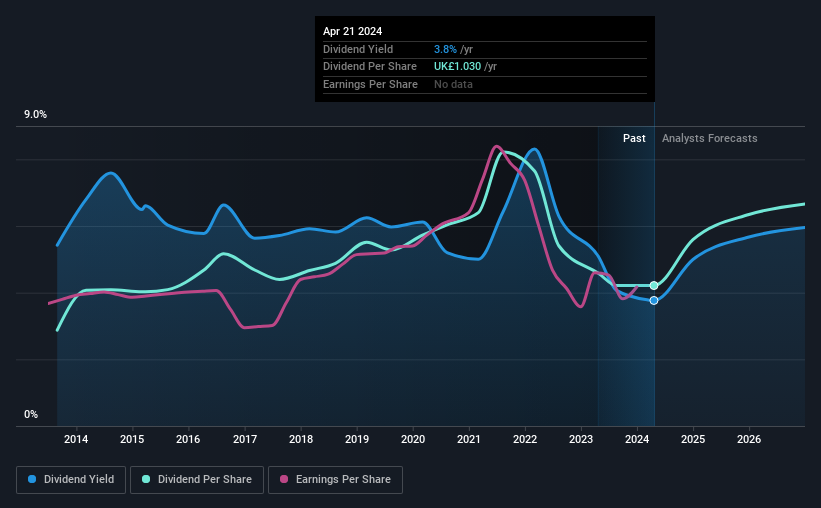
Dividend Volatility
Although the company has a long dividend history, it has been cut at least once in the last 10 years. Since 2014, the dividend has gone from £0.703 total annually to £1.03. This works out to be a compound annual growth rate (CAGR) of approximately 3.9% a year over that time. Modest growth in the dividend is good to see, but we think this is offset by historical cuts to the payments. It is hard to live on a dividend income if the company's earnings are not consistent.
The Dividend's Growth Prospects Are Limited
With a relatively unstable dividend, it's even more important to evaluate if earnings per share is growing, which could point to a growing dividend in the future. Over the past five years, it looks as though Admiral Group's EPS has declined at around 3.9% a year. If the company is making less over time, it naturally follows that it will also have to pay out less in dividends. It's not all bad news though, as the earnings are predicted to rise over the next 12 months - we would just be a bit cautious until this can turn into a longer term trend.
Admiral Group's Dividend Doesn't Look Sustainable
In summary, while it's good to see that the dividend hasn't been cut, we are a bit cautious about Admiral Group's payments, as there could be some issues with sustaining them into the future. While the low payout ratio is a redeeming feature, this is offset by the minimal cash to cover the payments. We would probably look elsewhere for an income investment.
It's important to note that companies having a consistent dividend policy will generate greater investor confidence than those having an erratic one. Still, investors need to consider a host of other factors, apart from dividend payments, when analysing a company. For example, we've picked out 1 warning sign for Admiral Group that investors should know about before committing capital to this stock. Looking for more high-yielding dividend ideas? Try our collection of strong dividend payers.
Have feedback on this article? Concerned about the content? Get in touch with us directly. Alternatively, email editorial-team (at) simplywallst.com.
This article by Simply Wall St is general in nature. We provide commentary based on historical data and analyst forecasts only using an unbiased methodology and our articles are not intended to be financial advice. It does not constitute a recommendation to buy or sell any stock, and does not take account of your objectives, or your financial situation. We aim to bring you long-term focused analysis driven by fundamental data. Note that our analysis may not factor in the latest price-sensitive company announcements or qualitative material. Simply Wall St has no position in any stocks mentioned.
