
 Yahoo Finance
 The Admiral Group (LON:ADM) Share Price Has Gained 70% And Shareholders Are Hoping For More

When we invest, we're generally looking for stocks that outperform the market average. And while active stock picking involves risks (and requires diversification) it can also provide excess returns. To wit, the Admiral Group share price has climbed 70% in five years, easily topping the market return of 4.6% (ignoring dividends). On the other hand, the more recent gains haven't been so impressive, with shareholders gaining just 9.6% , including dividends .
See our latest analysis for Admiral Group
To quote Buffett, 'Ships will sail around the world but the Flat Earth Society will flourish. There will continue to be wide discrepancies between price and value in the marketplace...' By comparing earnings per share (EPS) and share price changes over time, we can get a feel for how investor attitudes to a company have morphed over time.
During five years of share price growth, Admiral Group achieved compound earnings per share (EPS) growth of 5.2% per year. This EPS growth is slower than the share price growth of 11% per year, over the same period. This suggests that market participants hold the company in higher regard, these days. And that's hardly shocking given the track record of growth.
The image below shows how EPS has tracked over time (if you click on the image you can see greater detail).
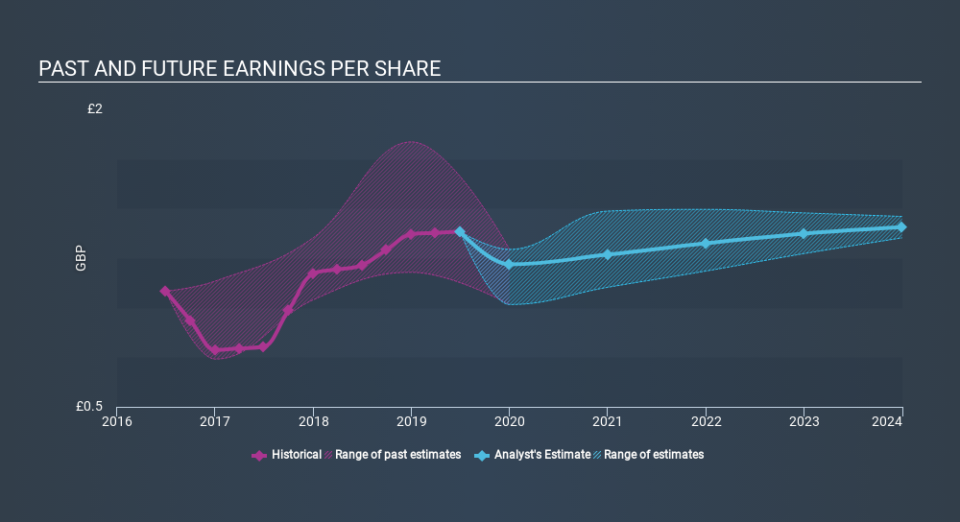
It's probably worth noting that the CEO is paid less than the median at similar sized companies. But while CEO remuneration is always worth checking, the really important question is whether the company can grow earnings going forward. Dive deeper into the earnings by checking this interactive graph of Admiral Group's earnings, revenue and cash flow.
What About Dividends?
As well as measuring the share price return, investors should also consider the total shareholder return (TSR). The TSR incorporates the value of any spin-offs or discounted capital raisings, along with any dividends, based on the assumption that the dividends are reinvested. So for companies that pay a generous dividend, the TSR is often a lot higher than the share price return. As it happens, Admiral Group's TSR for the last 5 years was 130%, which exceeds the share price return mentioned earlier. And there's no prize for guessing that the dividend payments largely explain the divergence!
A Different Perspective
Admiral Group shareholders are up 9.6% for the year (even including dividends) . But that return falls short of the market. On the bright side, the longer term returns (running at about 18% a year, over half a decade) look better. It may well be that this is a business worth popping on the watching, given the continuing positive reception, over time, from the market. If you would like to research Admiral Group in more detail then you might want to take a look at whether insiders have been buying or selling shares in the company.
Of course, you might find a fantastic investment by looking elsewhere. So take a peek at this free list of companies we expect will grow earnings.
Please note, the market returns quoted in this article reflect the market weighted average returns of stocks that currently trade on GB exchanges.
If you spot an error that warrants correction, please contact the editor at editorial-team@simplywallst.com. This article by Simply Wall St is general in nature. It does not constitute a recommendation to buy or sell any stock, and does not take account of your objectives, or your financial situation. Simply Wall St has no position in the stocks mentioned.
We aim to bring you long-term focused research analysis driven by fundamental data. Note that our analysis may not factor in the latest price-sensitive company announcements or qualitative material. Thank you for reading.
