
 Yahoo Finance
 Aferian Plc (LON:AFRN) Looks Inexpensive But Perhaps Not Attractive Enough
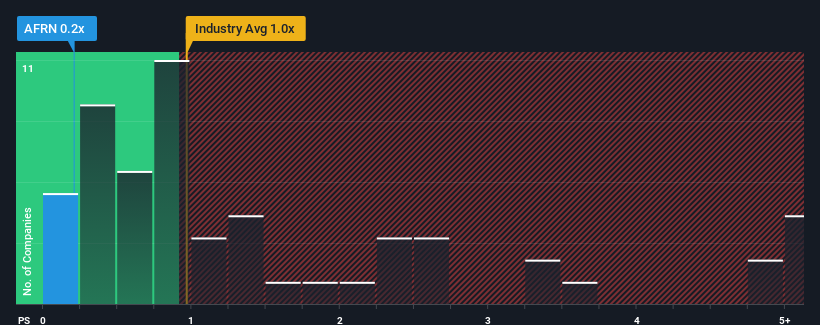
Aferian Plc's (LON:AFRN) price-to-sales (or "P/S") ratio of 0.2x might make it look like a buy right now compared to the Communications industry in the United Kingdom, where around half of the companies have P/S ratios above 1x and even P/S above 3x are quite common. Nonetheless, we'd need to dig a little deeper to determine if there is a rational basis for the reduced P/S.
View our latest analysis for Aferian
How Aferian Has Been Performing
With revenue that's retreating more than the industry's average of late, Aferian has been very sluggish. It seems that many are expecting the dismal revenue performance to persist, which has repressed the P/S. If you still like the company, you'd want its revenue trajectory to turn around before making any decisions. Or at the very least, you'd be hoping the revenue slide doesn't get any worse if your plan is to pick up some stock while it's out of favour.
Keen to find out how analysts think Aferian's future stacks up against the industry? In that case, our free report is a great place to start.
How Is Aferian's Revenue Growth Trending?
Aferian's P/S ratio would be typical for a company that's only expected to deliver limited growth, and importantly, perform worse than the industry.
In reviewing the last year of financials, we were disheartened to see the company's revenues fell to the tune of 24%. This means it has also seen a slide in revenue over the longer-term as revenue is down 13% in total over the last three years. So unfortunately, we have to acknowledge that the company has not done a great job of growing revenue over that time.
Looking ahead now, revenue is anticipated to slump, contracting by 31% during the coming year according to the only analyst following the company. Meanwhile, the broader industry is forecast to expand by 30%, which paints a poor picture.
In light of this, it's understandable that Aferian's P/S would sit below the majority of other companies. Nonetheless, there's no guarantee the P/S has reached a floor yet with revenue going in reverse. There's potential for the P/S to fall to even lower levels if the company doesn't improve its top-line growth.
The Final Word
Typically, we'd caution against reading too much into price-to-sales ratios when settling on investment decisions, though it can reveal plenty about what other market participants think about the company.
It's clear to see that Aferian maintains its low P/S on the weakness of its forecast for sliding revenue, as expected. Right now shareholders are accepting the low P/S as they concede future revenue probably won't provide any pleasant surprises. Unless these conditions improve, they will continue to form a barrier for the share price around these levels.
Having said that, be aware Aferian is showing 3 warning signs in our investment analysis, and 1 of those is a bit concerning.
If strong companies turning a profit tickle your fancy, then you'll want to check out this free list of interesting companies that trade on a low P/E (but have proven they can grow earnings).
Have feedback on this article? Concerned about the content? Get in touch with us directly. Alternatively, email editorial-team (at) simplywallst.com.
This article by Simply Wall St is general in nature. We provide commentary based on historical data and analyst forecasts only using an unbiased methodology and our articles are not intended to be financial advice. It does not constitute a recommendation to buy or sell any stock, and does not take account of your objectives, or your financial situation. We aim to bring you long-term focused analysis driven by fundamental data. Note that our analysis may not factor in the latest price-sensitive company announcements or qualitative material. Simply Wall St has no position in any stocks mentioned.
