
 Yahoo Finance
 African Rainbow Minerals (JSE:ARI) Is Looking To Continue Growing Its Returns On Capital
To find a multi-bagger stock, what are the underlying trends we should look for in a business? Firstly, we'll want to see a proven return on capital employed (ROCE) that is increasing, and secondly, an expanding base of capital employed. Basically this means that a company has profitable initiatives that it can continue to reinvest in, which is a trait of a compounding machine. So on that note, African Rainbow Minerals (JSE:ARI) looks quite promising in regards to its trends of return on capital.
Return On Capital Employed (ROCE): What Is It?
Just to clarify if you're unsure, ROCE is a metric for evaluating how much pre-tax income (in percentage terms) a company earns on the capital invested in its business. To calculate this metric for African Rainbow Minerals, this is the formula:
Return on Capital Employed = Earnings Before Interest and Tax (EBIT) ÷ (Total Assets - Current Liabilities)
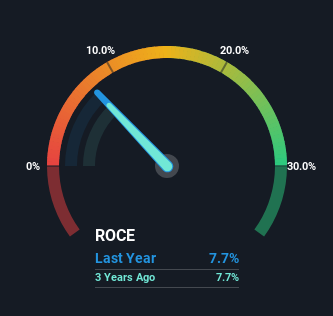
0.077 = R4.7b ÷ (R64b - R3.7b) (Based on the trailing twelve months to June 2023).
So, African Rainbow Minerals has an ROCE of 7.7%. In absolute terms, that's a low return and it also under-performs the Metals and Mining industry average of 17%.
View our latest analysis for African Rainbow Minerals
In the above chart we have measured African Rainbow Minerals' prior ROCE against its prior performance, but the future is arguably more important. If you'd like to see what analysts are forecasting going forward, you should check out our free report for African Rainbow Minerals.
What Can We Tell From African Rainbow Minerals' ROCE Trend?
While in absolute terms it isn't a high ROCE, it's promising to see that it has been moving in the right direction. The data shows that returns on capital have increased substantially over the last five years to 7.7%. The company is effectively making more money per dollar of capital used, and it's worth noting that the amount of capital has increased too, by 89%. So we're very much inspired by what we're seeing at African Rainbow Minerals thanks to its ability to profitably reinvest capital.
In Conclusion...
All in all, it's terrific to see that African Rainbow Minerals is reaping the rewards from prior investments and is growing its capital base. And with the stock having performed exceptionally well over the last five years, these patterns are being accounted for by investors. So given the stock has proven it has promising trends, it's worth researching the company further to see if these trends are likely to persist.
If you'd like to know more about African Rainbow Minerals, we've spotted 2 warning signs, and 1 of them is a bit unpleasant.
While African Rainbow Minerals isn't earning the highest return, check out this free list of companies that are earning high returns on equity with solid balance sheets.
Have feedback on this article? Concerned about the content? Get in touch with us directly. Alternatively, email editorial-team (at) simplywallst.com.
This article by Simply Wall St is general in nature. We provide commentary based on historical data and analyst forecasts only using an unbiased methodology and our articles are not intended to be financial advice. It does not constitute a recommendation to buy or sell any stock, and does not take account of your objectives, or your financial situation. We aim to bring you long-term focused analysis driven by fundamental data. Note that our analysis may not factor in the latest price-sensitive company announcements or qualitative material. Simply Wall St has no position in any stocks mentioned.
