
 Yahoo Finance
 African Rainbow Minerals Ltd's Dividend Analysis
Understanding the Dividend Prospects of African Rainbow Minerals Ltd
African Rainbow Minerals Ltd (AFBOF) recently announced a dividend of $6 per share, payable on 2024-04-08, with the ex-dividend date set for 2024-04-03. As investors look forward to this upcoming payment, the spotlight also shines on the company's dividend history, yield, and growth rates. Using the data from GuruFocus, let's look into African Rainbow Minerals Ltd's dividend performance and assess its sustainability.
What Does African Rainbow Minerals Ltd Do?
This Powerful Chart Made Peter Lynch 29% A Year For 13 Years
How to calculate the intrinsic value of a stock?
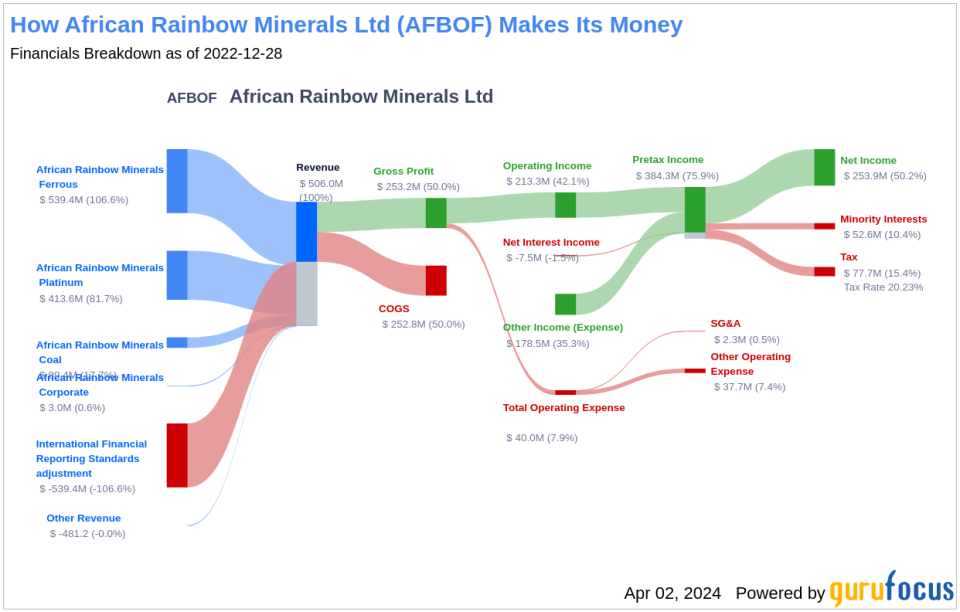
African Rainbow Minerals Ltd is a South African diversified mining and minerals company. The group has various operating divisions: platinum, ferrous, coal, copper, and corporate. In addition, African Rainbow Minerals has an investment in gold through its shareholding in Harmony. Ferrous is the group's largest division, contributing roughly half of group revenue, closely trailed by the platinum division. The platinum division includes the Two Rivers Platinum Mine as a 51% subsidiary and an interest in the Modikwa Platinum Mine. The ferrous division comprises Assmang as a 50% joint venture, which includes iron ore, manganese, and chrome operations.
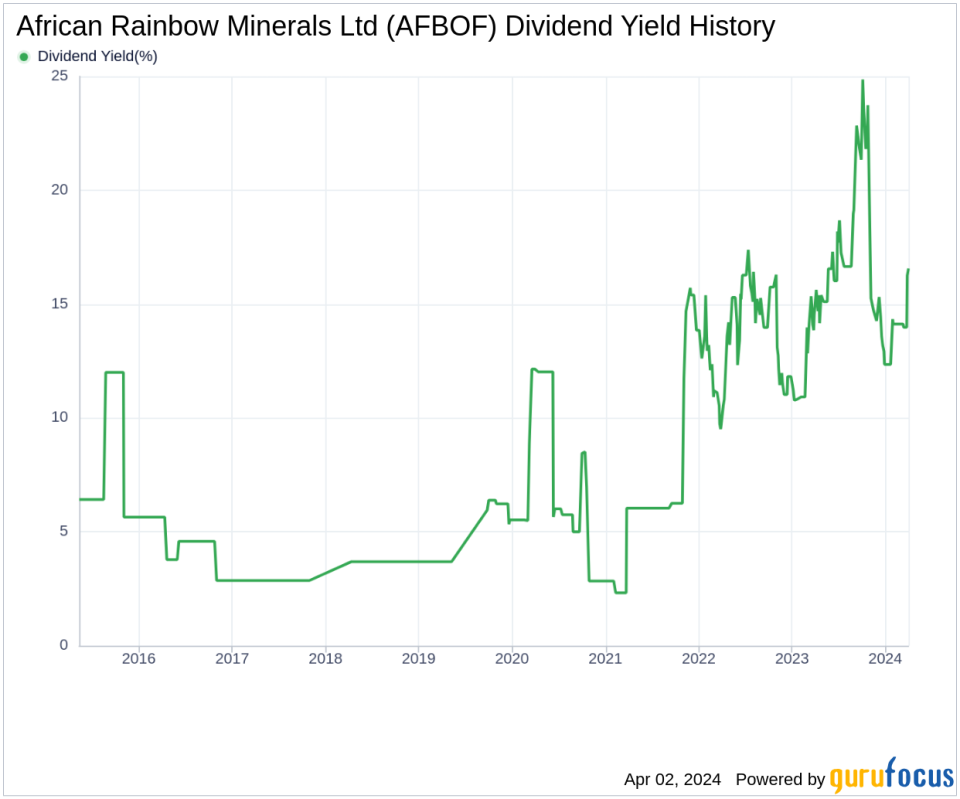
A Glimpse at African Rainbow Minerals Ltd's Dividend History
African Rainbow Minerals Ltd has maintained a consistent dividend payment record since 2018. Dividends are currently distributed on a bi-annual basis. Below is a chart showing annual Dividends Per Share for tracking historical trends.
Breaking Down African Rainbow Minerals Ltd's Dividend Yield and Growth
As of today, African Rainbow Minerals Ltd currently has a 12-month trailing dividend yield of 16.63% and a 12-month forward dividend yield of 7.60%. This suggests an expectation of decreased dividend payments over the next 12 months. Over the past three years, African Rainbow Minerals Ltd's annual dividend growth rate was 34.40%. Extended to a five-year horizon, this rate decreased to 32.70% per year. And over the past decade, African Rainbow Minerals Ltd's annual dividends per share growth rate stands at an impressive 25.30%.
Based on African Rainbow Minerals Ltd's dividend yield and five-year growth rate, the 5-year yield on cost of African Rainbow Minerals Ltd stock as of today is approximately 68.43%.
The Sustainability Question: Payout Ratio and Profitability
To assess the sustainability of the dividend, one needs to evaluate the company's payout ratio. The dividend payout ratio provides insights into the portion of earnings the company distributes as dividends. A lower ratio suggests that the company retains a significant part of its earnings, thereby ensuring the availability of funds for future growth and unexpected downturns. As of 2023-12-31, African Rainbow Minerals Ltd's dividend payout ratio is 0.76, which may suggest that the company's dividend may not be sustainable.
African Rainbow Minerals Ltd's profitability rank, offers an understanding of the company's earnings prowess relative to its peers. GuruFocus ranks African Rainbow Minerals Ltd's profitability 8 out of 10 as of 2023-12-31, suggesting good profitability prospects. The company has reported net profit in 9 years out of the past 10 years.
Growth Metrics: The Future Outlook
To ensure the sustainability of dividends, a company must have robust growth metrics. African Rainbow Minerals Ltd's growth rank of 8 out of 10 suggests that the company's growth trajectory is good relative to its competitors. African Rainbow Minerals Ltd's revenue per share, combined with the 3-year revenue growth rate, indicates a strong revenue model. African Rainbow Minerals Ltd's revenue has increased by approximately 8.10% per year on average, a rate that underperforms approximately 56.97% of global competitors.
The company's 3-year EPS growth rate showcases its capability to grow its earnings, a critical component for sustaining dividends in the long run. During the past three years, African Rainbow Minerals Ltd's earnings increased by approximately 17.60% per year on average, a rate that underperforms approximately 39.97% of global competitors.
Lastly, the company's 5-year EBITDA growth rate of 19.70%, which underperforms approximately 36.63% of global competitors.
Next Steps
In conclusion, African Rainbow Minerals Ltd's significant dividend yield and robust history of dividend growth are attractive to investors. However, the potential decrease in future dividends, as indicated by the forward yield, along with the payout ratio, may raise concerns about the sustainability of these dividends. The company's strong profitability and growth ranks indicate a solid foundation, but its revenue and earnings growth rates, when compared to global competitors, suggest there may be challenges ahead. Investors should weigh these factors, alongside the company's strategic initiatives and competitive position, when considering the long-term prospects of African Rainbow Minerals Ltd's dividends.
GuruFocus Premium users can screen for high-dividend yield stocks using the High Dividend Yield Screener.
This article, generated by GuruFocus, is designed to provide general insights and is not tailored financial advice. Our commentary is rooted in historical data and analyst projections, utilizing an impartial methodology, and is not intended to serve as specific investment guidance. It does not formulate a recommendation to purchase or divest any stock and does not consider individual investment objectives or financial circumstances. Our objective is to deliver long-term, fundamental data-driven analysis. Be aware that our analysis might not incorporate the most recent, price-sensitive company announcements or qualitative information. GuruFocus holds no position in the stocks mentioned herein.
This article first appeared on GuruFocus.
