
 Yahoo Finance
 Agilent Technologies (A) Down 4.5% Since Earnings Report: Can It Rebound?

A month has gone by since the last earnings report for Agilent Technologies, Inc. A. Shares have lost about 4.5% in that time frame.
Will the recent negative trend continue leading up to its next earnings release, or is A due for a breakout? Before we dive into how investors and analysts have reacted as of late, let's take a quick look at its most recent earnings report in order to get a better handle on the important drivers.
Agilent (A) Reports In-Line Q2 Earnings, Misses on Revenues
Agilent Technologies fiscal second-quarter 2018 earnings per share of 65 cents were inline with the Zacks Consensus Estimate. Earnings increased 12% year over year.
Also, the company’s shares have declined 13.9% in the past year, underperforming the industry’s gain of 17.7%.
Revenues
Agilent’s fiscal second-quarter 2018 revenues of $1.206 billion decreased 1% sequentially but increased 9% year over year. Revenues were above management’s guided range of $1.145-$1.165 billion but slightly below the Zacks Consensus Estimate of $1.209 billion.
The year-over-year revenue growth was supported by the strong improvement across all its product lines and regions, particularly in Europe.
Revenues by Segment
Agilent has three reporting segments — Life Sciences & Applied Markets Group (LSAG), Agilent Cross Lab Group (ACG) and Diagnostics and Genomics Group (DGG).
In the reported quarter, LSAG was the largest contributor and accounted for $561 million or 47% of the total revenues, reflecting an increase of 7% from the prior-year quarter. This was driven by strong performances in the mass spectrometry and cell analysis.
Revenues from ACG came in at $426 million or 36% of the total revenues, reflecting an increase of 13% year over year. Both services and consumables witnessed growth across all geographical regions.
Non-GAAP revenues from DGG came in at $219 million and accounted for the remaining 19% of the total revenues. The segment was up 9% from the year-ago quarter, led by strength in genomics.
Margins
The pro-forma gross margin in the quarter was 55.4%, down 150 basis points (bps) sequentially and 60 bps year over year.
Operating expenses (research & development and selling, general & administrative expenses) in the quarter were $407 million, 9% higher than the year-ago quarter. As a result, adjusted operating margin was 21.7%, down 50 basis points (bps) sequentially and 10 bps year over year.
Net Income
Agilent generated pro-forma net income of $212 million (65 cents per share) compared with $187 million (58 cents) in the year-ago quarter. Our pro-forma estimate excludes acquisition-related costs, restructuring charges, amortization of intangibles, and other one-time items as well as tax adjustments.
With these above-mentioned items included, GAAP net income was $205 million (63 cents per share) compared with $164 million (50 cents) in the year-ago quarter.
Balance Sheet
On exiting the fiscal second quarter, inventories were $594 million, down from $608 in the last reported quarter. Agilent’s long-term debt was $1.80 billion at the end of the quarter. Cash and cash equivalents were $3.01 billion compared with $2.89 billion in fiscal first-quarter 2018.
Net cash provided by operating activities was $303 million and capital expenditure totaled $48 million.
In the reported quarter, the company paid $48 million in dividends. There was no share repurchase activity during the period.
Guidance
Agilent provided guidance for fiscal third quarter of 2018.
Agilent expects revenues between $1.185 billion and $1.205 billion, and non-GAAP earnings per share in the range of 61-63 cents for the fiscal third quarter.
For fiscal 2018, Agilent projects revenues in the range of $4.850-$4.870 billion and non-GAAP earnings per share within $2.63-$2.67.
How Have Estimates Been Moving Since Then?
In the past month, investors have witnessed a downward trend in fresh estimates. There have been five revisions lower for the current quarter.
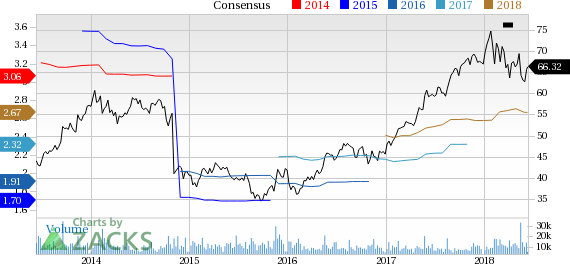
Agilent Technologies, Inc. Price and Consensus
Agilent Technologies, Inc. Price and Consensus | Agilent Technologies, Inc. Quote
VGM Scores
At this time, A has a nice Growth Score of B, though it is lagging a lot on the momentum front with a D. The stock was allocated a grade of C on the value side, putting it in the middle 20% for this investment strategy.
Overall, the stock has an aggregate VGM Score of C. If you aren't focused on one strategy, this score is the one you should be interested in.
Our style scores indicate that the stock is more suitable for growth investors than value investors.
Outlook
Estimates have been broadly trending downward for the stock and the magnitude of these revisions indicates a downward shift. Interestingly, A has a Zacks Rank #3 (Hold). We expect an in-line return from the stock in the next few months.
Want the latest recommendations from Zacks Investment Research? Today, you can download 7 Best Stocks for the Next 30 Days. Click to get this free report
Agilent Technologies, Inc. (A) : Free Stock Analysis Report
To read this article on Zacks.com click here.
