
 Yahoo Finance
 Do You Like AIREA plc (LON:AIEA) At This P/E Ratio?

This article is written for those who want to get better at using price to earnings ratios (P/E ratios). To keep it practical, we'll show how AIREA plc's (LON:AIEA) P/E ratio could help you assess the value on offer. AIREA has a P/E ratio of 8.83, based on the last twelve months. That means that at current prices, buyers pay £8.83 for every £1 in trailing yearly profits.
View our latest analysis for AIREA
How Do You Calculate A P/E Ratio?
The formula for price to earnings is:
Price to Earnings Ratio = Share Price ÷ Earnings per Share (EPS)
Or for AIREA:
P/E of 8.83 = £0.72 ÷ £0.082 (Based on the year to December 2018.)
Is A High Price-to-Earnings Ratio Good?
A higher P/E ratio means that buyers have to pay a higher price for each £1 the company has earned over the last year. That is not a good or a bad thing per se, but a high P/E does imply buyers are optimistic about the future.
How Growth Rates Impact P/E Ratios
Generally speaking the rate of earnings growth has a profound impact on a company's P/E multiple. When earnings grow, the 'E' increases, over time. And in that case, the P/E ratio itself will drop rather quickly. A lower P/E should indicate the stock is cheap relative to others -- and that may attract buyers.
It's nice to see that AIREA grew EPS by a stonking 35% in the last year. And its annual EPS growth rate over 3 years is 83%. With that performance, I would expect it to have an above average P/E ratio.
How Does AIREA's P/E Ratio Compare To Its Peers?
One good way to get a quick read on what market participants expect of a company is to look at its P/E ratio. We can see in the image below that the average P/E (10.2) for companies in the consumer durables industry is higher than AIREA's P/E.
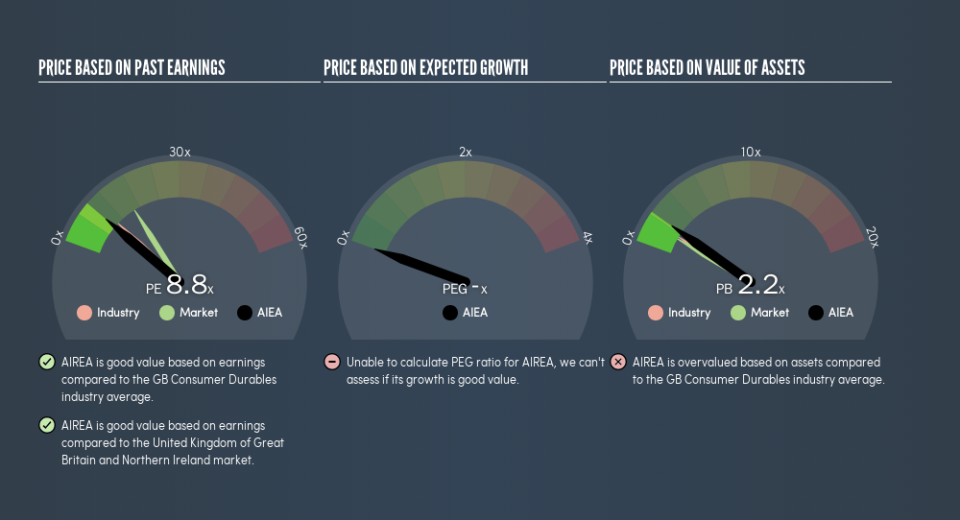
AIREA's P/E tells us that market participants think it will not fare as well as its peers in the same industry. While current expectations are low, the stock could be undervalued if the situation is better than the market assumes. You should delve deeper. I like to check if company insiders have been buying or selling.
A Limitation: P/E Ratios Ignore Debt and Cash In The Bank
It's important to note that the P/E ratio considers the market capitalization, not the enterprise value. Thus, the metric does not reflect cash or debt held by the company. The exact same company would hypothetically deserve a higher P/E ratio if it had a strong balance sheet, than if it had a weak one with lots of debt, because a cashed up company can spend on growth.
Such expenditure might be good or bad, in the long term, but the point here is that the balance sheet is not reflected by this ratio.
So What Does AIREA's Balance Sheet Tell Us?
Since AIREA holds net cash of UK£2.2m, it can spend on growth, justifying a higher P/E ratio than otherwise.
The Bottom Line On AIREA's P/E Ratio
AIREA's P/E is 8.8 which is below average (16.3) in the GB market. It grew its EPS nicely over the last year, and the healthy balance sheet implies there is more potential for growth. The below average P/E ratio suggests that market participants don't believe the strong growth will continue.
Investors should be looking to buy stocks that the market is wrong about. If the reality for a company is not as bad as the P/E ratio indicates, then the share price should increase as the market realizes this. We don't have analyst forecasts, but you might want to assess this data-rich visualization of earnings, revenue and cash flow.
Of course, you might find a fantastic investment by looking at a few good candidates. So take a peek at this free list of companies with modest (or no) debt, trading on a P/E below 20.
We aim to bring you long-term focused research analysis driven by fundamental data. Note that our analysis may not factor in the latest price-sensitive company announcements or qualitative material.
If you spot an error that warrants correction, please contact the editor at editorial-team@simplywallst.com. This article by Simply Wall St is general in nature. It does not constitute a recommendation to buy or sell any stock, and does not take account of your objectives, or your financial situation. Simply Wall St has no position in the stocks mentioned. Thank you for reading.
