
 Yahoo Finance
 AIREA plc's (LON:AIEA) Shares Not Telling The Full Story
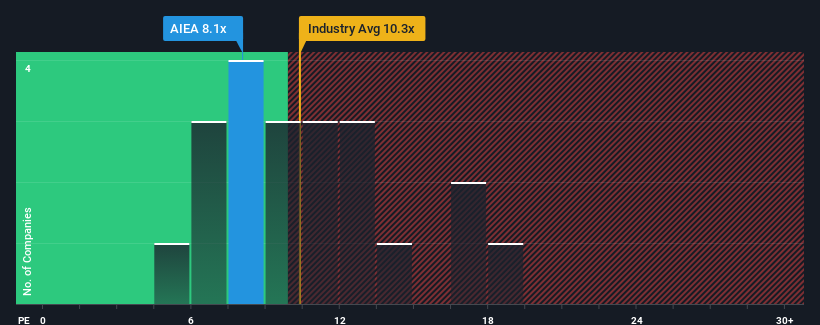
AIREA plc's (LON:AIEA) price-to-earnings (or "P/E") ratio of 8.1x might make it look like a buy right now compared to the market in the United Kingdom, where around half of the companies have P/E ratios above 16x and even P/E's above 28x are quite common. Although, it's not wise to just take the P/E at face value as there may be an explanation why it's limited.
For instance, AIREA's receding earnings in recent times would have to be some food for thought. One possibility is that the P/E is low because investors think the company won't do enough to avoid underperforming the broader market in the near future. If you like the company, you'd be hoping this isn't the case so that you could potentially pick up some stock while it's out of favour.
View our latest analysis for AIREA
We don't have analyst forecasts, but you can see how recent trends are setting up the company for the future by checking out our free report on AIREA's earnings, revenue and cash flow.
Does Growth Match The Low P/E?
There's an inherent assumption that a company should underperform the market for P/E ratios like AIREA's to be considered reasonable.
Taking a look back first, the company's earnings per share growth last year wasn't something to get excited about as it posted a disappointing decline of 6.6%. However, a few very strong years before that means that it was still able to grow EPS by an impressive 100% in total over the last three years. So we can start by confirming that the company has generally done a very good job of growing earnings over that time, even though it had some hiccups along the way.
This is in contrast to the rest of the market, which is expected to grow by 13% over the next year, materially lower than the company's recent medium-term annualised growth rates.
With this information, we find it odd that AIREA is trading at a P/E lower than the market. Apparently some shareholders believe the recent performance has exceeded its limits and have been accepting significantly lower selling prices.
The Bottom Line On AIREA's P/E
Generally, our preference is to limit the use of the price-to-earnings ratio to establishing what the market thinks about the overall health of a company.
We've established that AIREA currently trades on a much lower than expected P/E since its recent three-year growth is higher than the wider market forecast. When we see strong earnings with faster-than-market growth, we assume potential risks are what might be placing significant pressure on the P/E ratio. At least price risks look to be very low if recent medium-term earnings trends continue, but investors seem to think future earnings could see a lot of volatility.
Having said that, be aware AIREA is showing 2 warning signs in our investment analysis, and 1 of those is significant.
Of course, you might also be able to find a better stock than AIREA. So you may wish to see this free collection of other companies that have reasonable P/E ratios and have grown earnings strongly.
Have feedback on this article? Concerned about the content? Get in touch with us directly. Alternatively, email editorial-team (at) simplywallst.com.
This article by Simply Wall St is general in nature. We provide commentary based on historical data and analyst forecasts only using an unbiased methodology and our articles are not intended to be financial advice. It does not constitute a recommendation to buy or sell any stock, and does not take account of your objectives, or your financial situation. We aim to bring you long-term focused analysis driven by fundamental data. Note that our analysis may not factor in the latest price-sensitive company announcements or qualitative material. Simply Wall St has no position in any stocks mentioned.
