
 Yahoo Finance
 AIREA plc's (LON:AIEA) Stock Has Shown A Decent Performance: Have Financials A Role To Play?
AIREA's (LON:AIEA) stock up by 6.9% over the past three months. We wonder if and what role the company's financials play in that price change as a company's long-term fundamentals usually dictate market outcomes. In this article, we decided to focus on AIREA's ROE.
Return on equity or ROE is a key measure used to assess how efficiently a company's management is utilizing the company's capital. Simply put, it is used to assess the profitability of a company in relation to its equity capital.
Check out our latest analysis for AIREA
How Do You Calculate Return On Equity?
ROE can be calculated by using the formula:
Return on Equity = Net Profit (from continuing operations) ÷ Shareholders' Equity
So, based on the above formula, the ROE for AIREA is:
2.8% = UK£391k ÷ UK£14m (Based on the trailing twelve months to December 2020).
The 'return' refers to a company's earnings over the last year. Another way to think of that is that for every £1 worth of equity, the company was able to earn £0.03 in profit.
What Is The Relationship Between ROE And Earnings Growth?
So far, we've learned that ROE is a measure of a company's profitability. We now need to evaluate how much profit the company reinvests or "retains" for future growth which then gives us an idea about the growth potential of the company. Generally speaking, other things being equal, firms with a high return on equity and profit retention, have a higher growth rate than firms that don’t share these attributes.
AIREA's Earnings Growth And 2.8% ROE
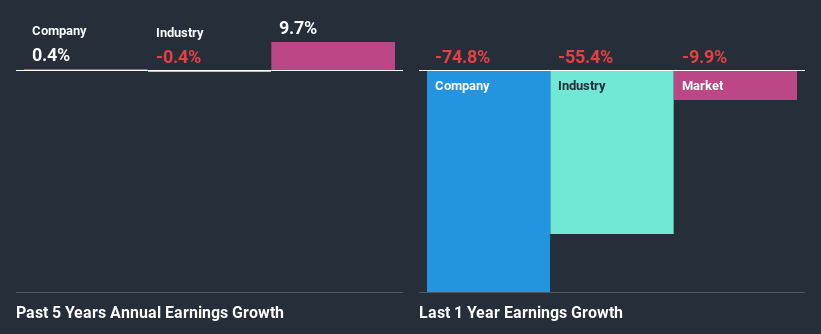
As you can see, AIREA's ROE looks pretty weak. Not just that, even compared to the industry average of 5.6%, the company's ROE is entirely unremarkable. Therefore, AIREA's flat earnings over the past five years can possibly be explained by the low ROE amongst other factors.
We then compared AIREA's net income growth with the industry and found that the industry which has shrunk at a rate of 0.4% in the same period, which makes the company's growth somewhat better.
Earnings growth is a huge factor in stock valuation. What investors need to determine next is if the expected earnings growth, or the lack of it, is already built into the share price. This then helps them determine if the stock is placed for a bright or bleak future. One good indicator of expected earnings growth is the P/E ratio which determines the price the market is willing to pay for a stock based on its earnings prospects. So, you may want to check if AIREA is trading on a high P/E or a low P/E, relative to its industry.
Is AIREA Efficiently Re-investing Its Profits?
While the company did pay out a portion of its dividend in the past, it currently doesn't pay a dividend. We infer that the company has been reinvesting all of its profits to grow its business.
Summary
In total, it does look like AIREA has some positive aspects to its business. Even in spite of the low rate of return, the company has posted impressive earnings growth as a result of reinvesting heavily into its business. Up till now, we've only made a short study of the company's growth data. You can do your own research on AIREA and see how it has performed in the past by looking at this FREE detailed graph of past earnings, revenue and cash flows.
This article by Simply Wall St is general in nature. It does not constitute a recommendation to buy or sell any stock, and does not take account of your objectives, or your financial situation. We aim to bring you long-term focused analysis driven by fundamental data. Note that our analysis may not factor in the latest price-sensitive company announcements or qualitative material. Simply Wall St has no position in any stocks mentioned.
Have feedback on this article? Concerned about the content? Get in touch with us directly. Alternatively, email editorial-team (at) simplywallst.com.